One number per market, and the arithmetic that produced it.
Every indicator vendor sells a score from 0 to 100. The only thing that separates one from another is whether you can take it apart. Every weight in this model is published, every driver opens, and every score carries what changed since yesterday.
The weights
A currency, 7 components, published.
Retail sentiment is drawn differently because it works differently: it is the one component read contrarian, so a crowded long counts against the bullish case rather than for it.
Indices are scored on their own set
Because earnings matter and a rate differential does not.
The bands
Neutral is wide, and that is on purpose.
Not a split at 50. A model that turns from bearish to bullish at 50.1 is presenting noise as a signal, so there is a band in the middle where the honest answer is that the evidence does not point anywhere.
Depth
A number, or a derivation.
The panels
Ten boards.
- Asset scores. Every one of the 24 monitored markets with its composite and its bias, in one table.
- Currency anatomy. One currency taken apart: each scored driver, what it is reading, and what it contributed.
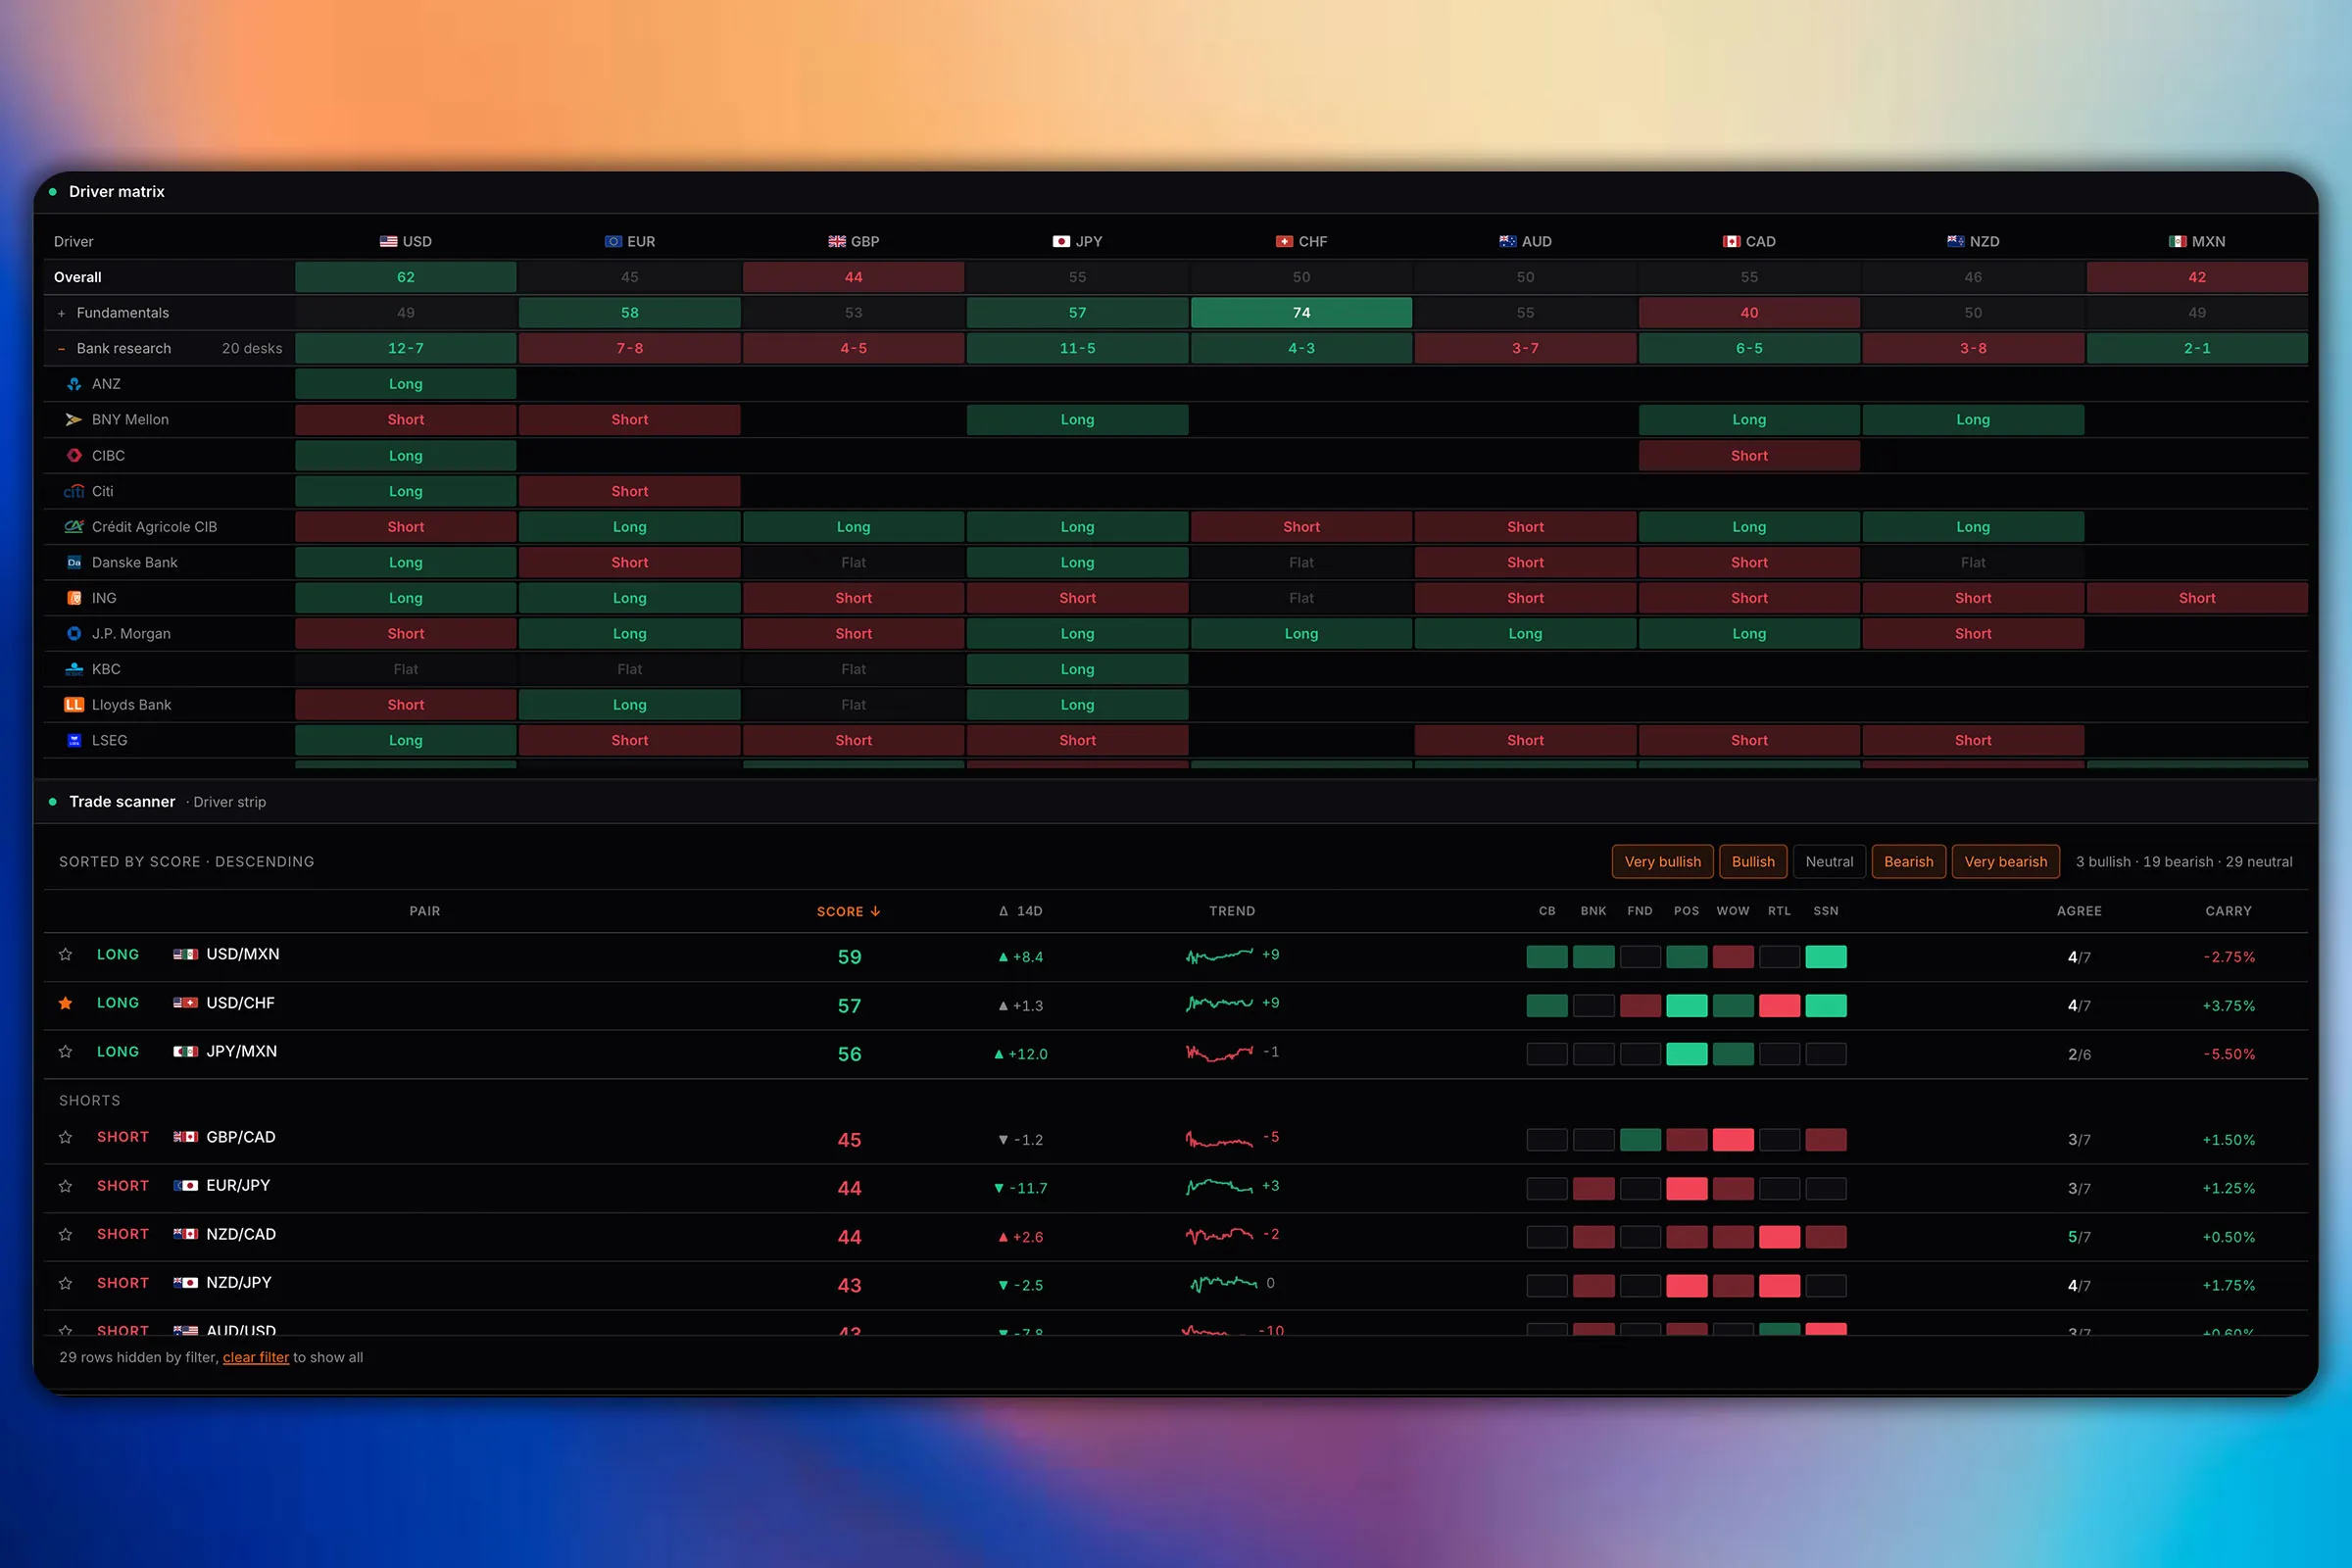
- Driver matrix. Every driver against every currency in one grid, so a currency that is strong for one reason and one that is strong for six are visibly different.
- Research desk. One asset read end to end: what the composite is made of and what each part is saying.
- Score-shift log. What moved and by how much, as a change log, ranked by size. The answer to "why is this different from yesterday".
- Weekly score movers. The currencies whose composite moved most over the week, which is usually where the story is.
- Conviction ranks. Currencies ranked by how far the score sits from neutral, because distance from the middle is the part that matters.
- Asset score history. The composite trajectory across the recorded history for one asset.
- Capital rotation map. Each asset plotted by relative strength and momentum, so rotation between them is visible rather than inferred.
- Currency snapshot card. One currency at a glance: the composite, the bias and the contributions behind it.
The scoring model, answered.
What do the numbers mean?
A composite from 0 to 100 per market. Bullish is 56 and above, bearish is below 45, and everything between is neutral. That is a deliberately wide neutral band: a model that flips from bullish to bearish at 50.1 is presenting noise as a signal.
What goes into the score?
7 components for a currency: fundamentals at 22.5%, central bank at 18%, bank research at 18%, seasonality at 13.5%, retail sentiment at 10%, cot level at 9%, cot flow at 9%. Indices are scored on their own set, because earnings and breadth matter for an index and a rate differential does not in the same way.
Why is retail sentiment subtracted rather than added?
Because it is read contrarian. When the retail crowd is heavily long a market, that is treated as a mark against the bullish case rather than for it, at a weight of 10%. It is the only component in the model that works in the opposite direction to its own reading, and it is the one most people misread.
Can I see how a score was reached?
Yes, and this is the whole point. Every score opens into its drivers: what each component is reading, what it contributed, and what changed since yesterday. A number you cannot take apart is an opinion with a decimal point on it.
Do the weights ever change?
Occasionally, when the evidence warrants it. They are published rather than described, so a change is visible rather than silent.
How many markets are scored?
24: the 9 currencies, 6 metals and energy contracts, and 9 equity indices.
Is scoring free?
The free plan carries 32 of the 103 panels across 2 boards, and which ones is listed on the pricing page. Everything else is on Pro at $49 a month.