The data beat expectations. The question is whether the pair noticed.
Every calendar tells you what printed. A surprise index tells you whether the run of data is beating or missing what was priced. Neither tells you whether the pair you trade is still moving with it, and for long stretches it is not. WatchTower carries all three, and the third one says plainly when the answer is no.
Three questions
In the order a trader actually asks them.
-
What was expected, and what printed
The calendar
Every release with actual, forecast and previous, across the window you choose. This part is a commodity: every broker gives it away, and so does this.
-
Whether the run of data is beating or missing
The surprise index
One number per currency built from how its recent releases landed against consensus, weighted so a payrolls miss is not treated like a second-tier survey. It answers whether an economy is running hot or cold relative to what was already priced, which is the part the level of any single print cannot tell you.
-
Whether the pair is still moving with it
Sensitivity
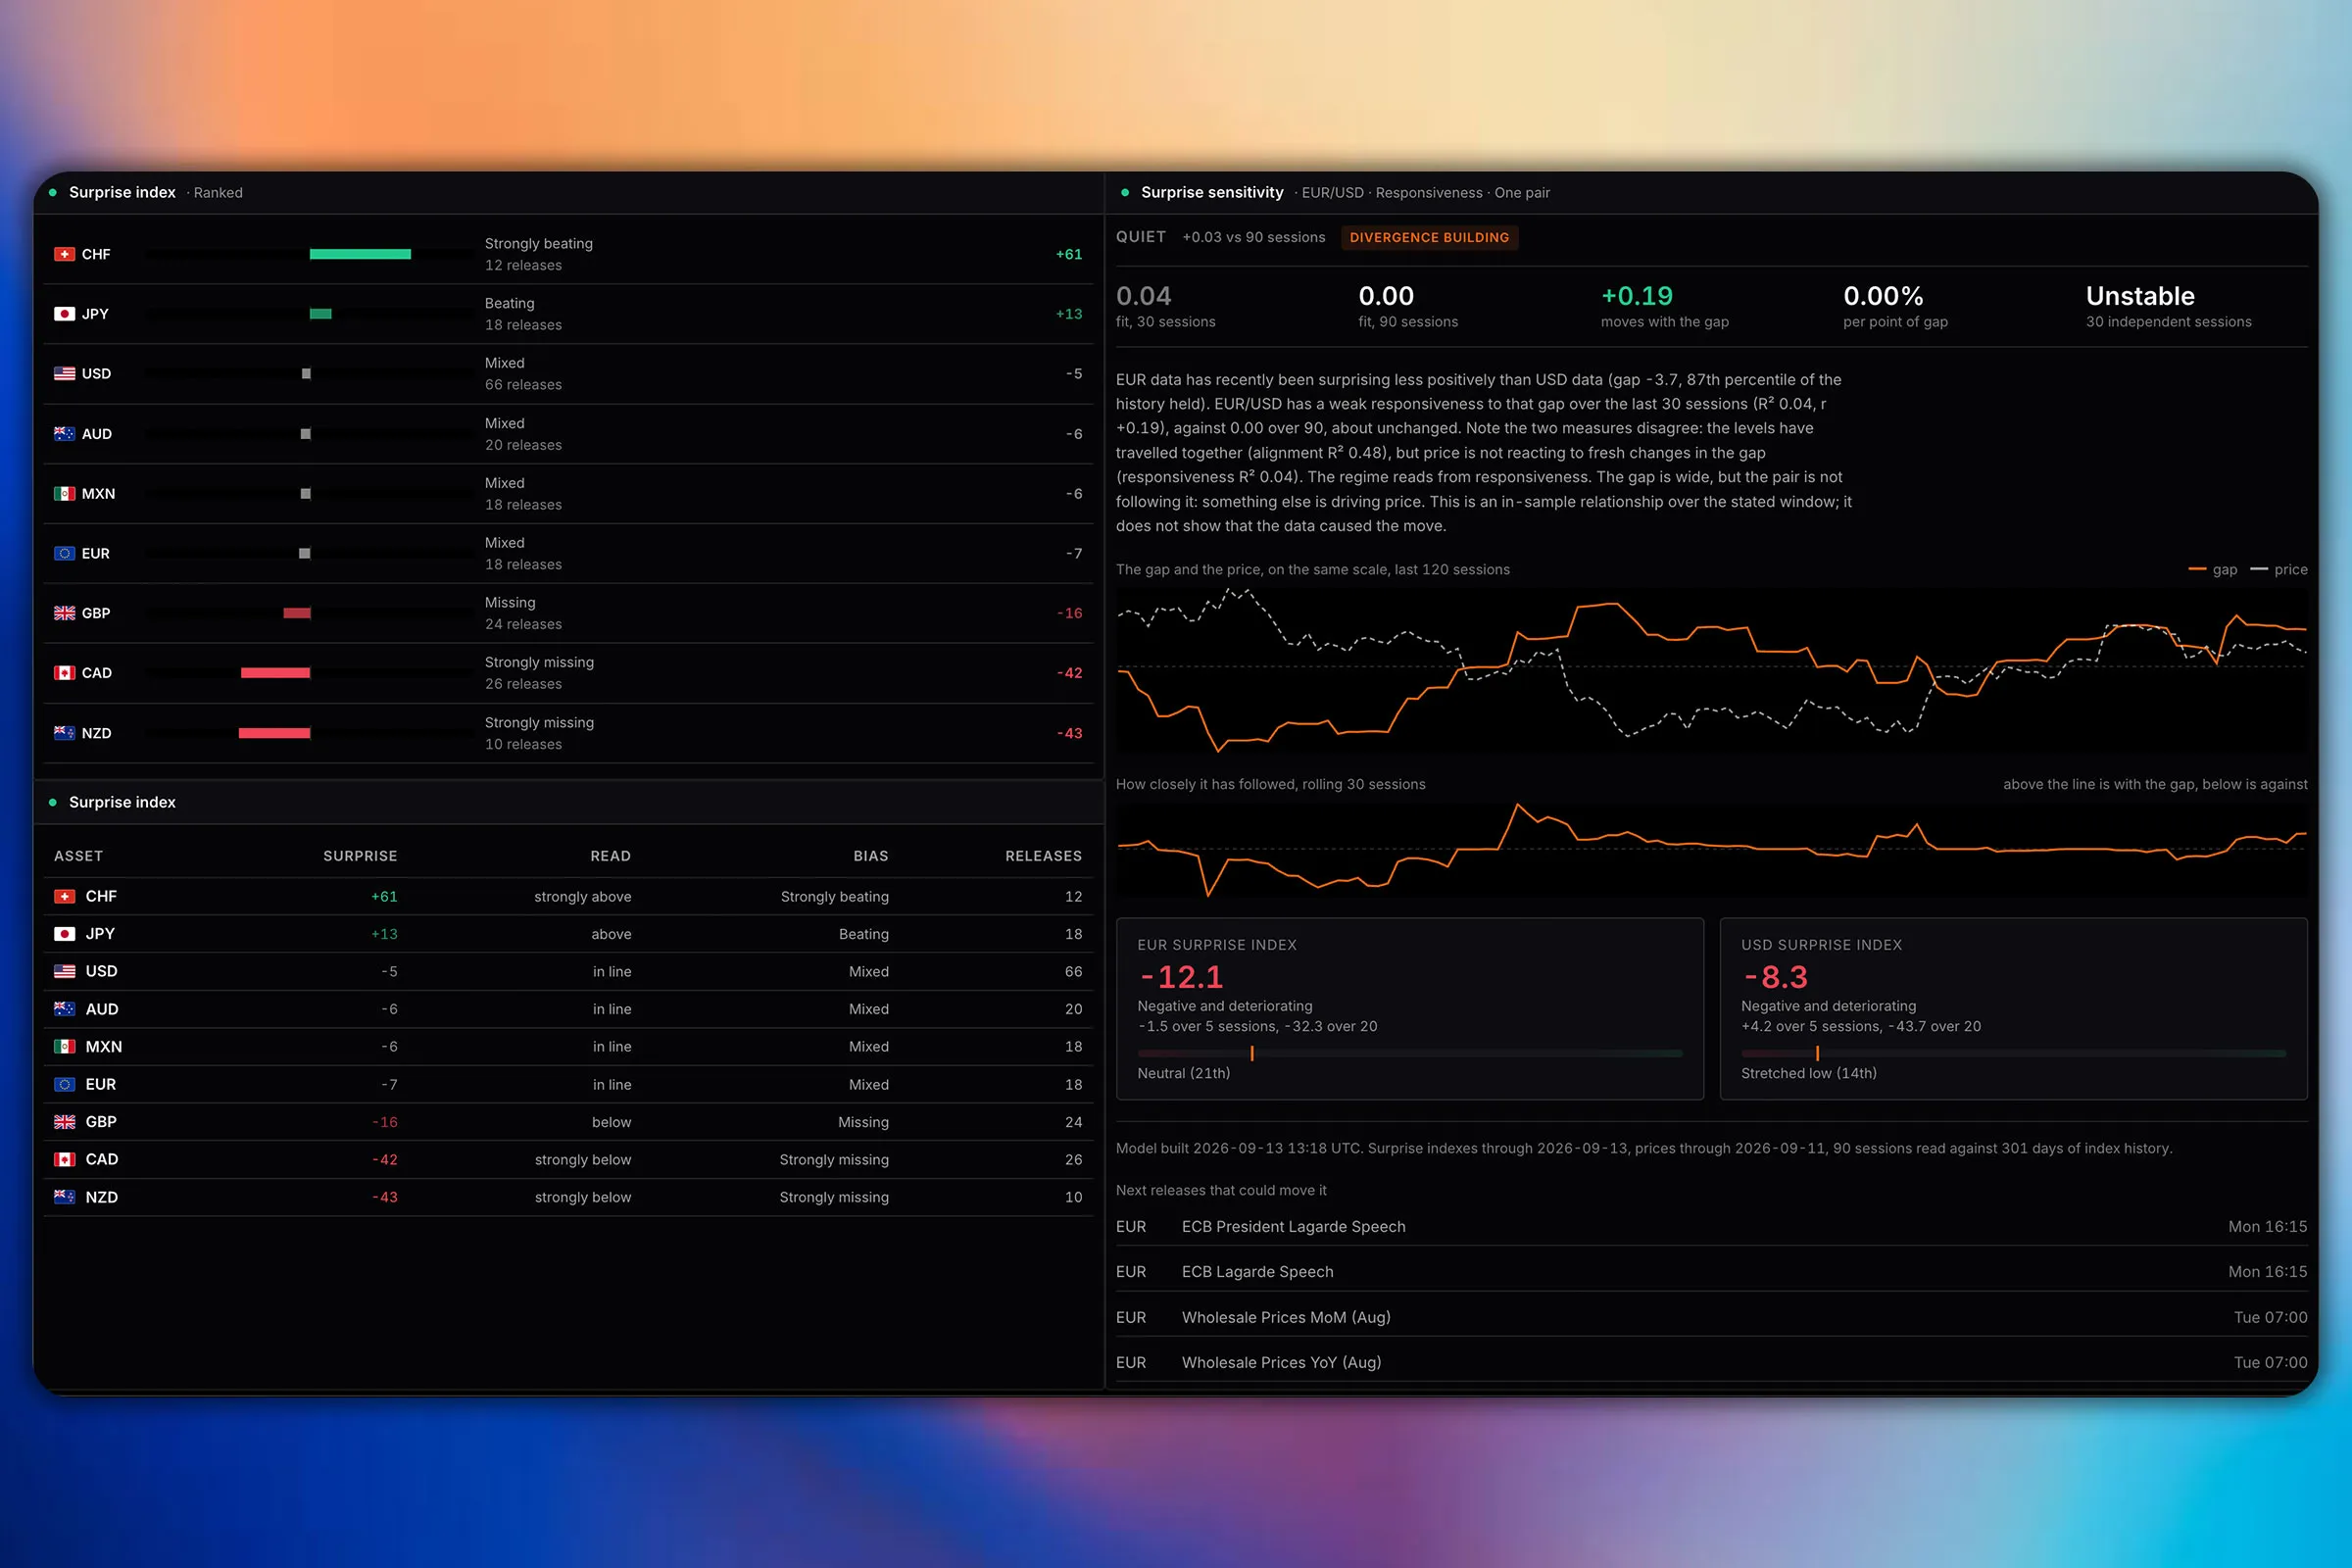
The question nobody else asks. A pair can have a wide surprise differential and ignore it completely, because the market is trading something else that month. This measures how closely a pair has actually tracked the gap recently, and says plainly when the answer is "it has not".
Depth
A calendar, or a read.
Being straight about it
What this measurement cannot do.
Sensitivity is a measurement of recent behaviour, not a forecast. It says how closely a pair has been tracking the surprise differential over the window, and it carries a stated confidence so a thin or noisy relationship is not presented at the same weight as a strong one. It does not say the pair will move on the next print.
The useful reading is often the negative one. A pair with a wide differential and no sensitivity is telling you the market is trading something else this month, which is worth knowing before you build a trade on a data thesis the market has stopped pricing.
The panels
Nine boards.
- Surprise index. How each currency recent data has landed against consensus, weighted by how much each release matters.
- Surprise sensitivity. Whether a pair is actually moving with the surprise differential, with a plain statement of confidence and a label when it is not.
- Economic calendar. Every release with actual, forecast and previous, across the window and the currencies you choose.
- Recent releases. What has printed in the last day, with the figure and what was expected, so a move has an explanation attached.
- Event countdown. A live countdown to the next high-impact events on the currencies you track.
- Asset releases. Every scored release for one asset in a single table: what it printed, what was expected and how it was scored.
- Macro fundamentals. The fundamentals score for each of the 9 currencies, broken into the components behind it.
- Fundamentals compare. Two currencies side by side across the full set of macro indicators, which is how a pair actually gets read.
- Macro indicator history. Any currency and any indicator through time, as bars or a line.
Surprise and sensitivity, answered.
What is an economic surprise index?
A single figure per economy built from how its recent data releases landed against the consensus forecast, rather than from the level of the data itself. An economy printing weak numbers that everyone already expected is not a surprise; one printing merely acceptable numbers where a disaster was priced is. Markets move on the gap, not the level.
How is it weighted?
By how much each release matters, so a first-tier print is not treated like a second-tier survey, and by recency, so a month-old surprise fades rather than sitting in the number forever.
Does a wide surprise differential mean the pair will move?
No, and this is the part worth reading twice. A differential says the data is diverging; it does not say the market cares this month. Pairs go through long stretches driven by rate expectations, risk appetite or flow, ignoring the data entirely. That is exactly why the sensitivity panel exists: it measures whether the pair has actually been tracking the gap, and says so plainly when it has not.
Is the sensitivity reading a forecast?
No. It is a measurement of recent behaviour with a stated confidence, not a prediction of the next print. A reading with thin history or a weak relationship is labelled as such rather than presented at the same weight as a strong one.
Which currencies are covered?
All 9, and the sensitivity read covers the pairs between them.
Is it free?
The free plan carries 32 of the 103 panels, on 2 boards you build and arrange yourself, and which panels is listed on the pricing page. Everything else is on Pro at $49 a month.