What the market has priced for the next meeting, and what it was derived from.
Every rate probability you read somewhere is the output of a curve fitted to an instrument, and almost nobody tells you which instrument. WatchTower prices 8 central banks meeting by meeting, publishes the instrument behind each curve, and marks any reading that would not survive a realistic wobble in the assumptions underneath it.
European Central Bank
Exchange-traded futures, WatchTower model
| Meeting | Implied rate | vs now | Priced outcome | ||
|---|---|---|---|---|---|
| 29 Oct 2026 | 2.64% | +14bp | cut— | hold— | hike— |
| 17 Dec 2026 | 2.73% | +23bp | cut— | hold— | hike— |
| 4 Feb 2027 | 3.11% | +61bp | cut— | hold— | hike— |
| 18 Mar 2027 | 3.36% | +86bp | cut— | hold— | hike— |
| 29 Apr 2027 | 3.09% | +59bp | cut— | hold— | hike— |
| 10 Jun 2027 | 3.25% | +75bp | cut— | hold— | hike— |
| 22 Jul 2027 | 3.44% | +94bp | cut— | hold— | hike— |
| 9 Sept 2027 | 3.44% | +94bp | cut— | hold— | hike— |
| 28 Oct 2027 | 3.44% | +94bp | cut— | hold— | hike— |
| 16 Dec 2027 | 3.44% | +94bp | cut— | hold— | hike— |
| 3 Feb 2028 | 3.44% | +94bp | cut— | hold— | hike— |
| 23 Mar 2028 | 3.44% | +94bp | cut— | hold— | hike— |
| 4 May 2028 | 3.44% | +94bp | cut— | hold— | hike— |
| 8 Jun 2028 | 3.44% | +94bp | cut— | hold— | hike— |
| 20 Jul 2028 | 3.44% | +94bp | cut— | hold— | hike— |
| 7 Sept 2028 | 3.44% | +94bp | cut— | hold— | hike— |
| 12 Oct 2028 | 3.44% | +94bp | cut— | hold— | hike— |
| 7 Dec 2028 | 3.44% | +94bp | cut— | hold— | hike— |
Implied rate is where the market prices the policy rate after that meeting. The three outcomes are the split for that meeting alone, not cumulative; the one in bold is what the curve leads with. Derived from Exchange-traded futures, WatchTower model.
Bank of England
Exchange-traded futures, WatchTower model
| Meeting | Implied rate | vs now | Priced outcome | ||
|---|---|---|---|---|---|
| 5 Nov 2026 | 3.92% | +17bp | cut— | hold— | hike— |
| 17 Dec 2026 | 4.10% | +35bp | cut— | hold— | hike— |
| 4 Feb 2027 | 4.29% | +54bp | cut— | hold— | hike— |
| 18 Mar 2027 | 4.48% | +73bp | cut— | hold— | hike— |
| 29 Apr 2027 | 4.62% | +87bp | cut— | hold— | hike— |
| 17 Jun 2027 | 4.69% | +94bp | cut— | hold— | hike— |
| 29 Jul 2027 | 4.75% | +100bp | cut— | hold— | hike— |
| 16 Sept 2027 | 4.79% | +105bp | cut— | hold— | hike— |
| 4 Nov 2027 | 4.82% | +107bp | cut— | hold— | hike— |
| 16 Dec 2027 | 4.82% | +107bp | cut— | hold— | hike— |
Implied rate is where the market prices the policy rate after that meeting. The three outcomes are the split for that meeting alone, not cumulative; the one in bold is what the curve leads with. Derived from Exchange-traded futures, WatchTower model.
Bank of Japan
Exchange-traded futures, WatchTower model
| Meeting | Implied rate | vs now | Priced outcome | ||
|---|---|---|---|---|---|
| 30 Oct 2026 | 1.25% | 0bp | cut— | hold— | hike— |
| 18 Dec 2026 | 1.44% | +19bp | cut— | hold— | hike— |
| 22 Jan 2027 | 1.60% | +35bp | cut— | hold— | hike— |
| 18 Mar 2027 | 1.71% | +46bp | cut— | hold— | hike— |
| 28 Apr 2027 | 1.81% | +56bp | cut— | hold— | hike— |
| 11 Jun 2027 | 1.89% | +64bp | cut— | hold— | hike— |
| 22 Jul 2027 | 1.97% | +72bp | cut— | hold— | hike— |
| 22 Sept 2027 | 2.05% | +80bp | cut— | hold— | hike— |
| 29 Oct 2027 | 2.12% | +87bp | cut— | hold— | hike— |
| 17 Dec 2027 | 2.17% | +92bp | cut— | hold— | hike— |
Implied rate is where the market prices the policy rate after that meeting. The three outcomes are the split for that meeting alone, not cumulative; the one in bold is what the curve leads with. Derived from Exchange-traded futures, WatchTower model.
Swiss National Bank
Exchange-traded futures, WatchTower model
| Meeting | Implied rate | vs now | Priced outcome | ||
|---|---|---|---|---|---|
| 10 Dec 2026 | 0.22% | +22bp | cut— | hold— | hike— |
| 18 Mar 2027 | 0.42% | +43bp | cut— | hold— | hike— |
| 17 Jun 2027 | 0.59% | +59bp | cut— | hold— | hike— |
| 23 Sept 2027 | 0.71% | +71bp | cut— | hold— | hike— |
| 9 Dec 2027 | 0.84% | +84bp | cut— | hold— | hike— |
Implied rate is where the market prices the policy rate after that meeting. The three outcomes are the split for that meeting alone, not cumulative; the one in bold is what the curve leads with. Derived from Exchange-traded futures, WatchTower model.
Reserve Bank of Australia
Exchange-traded futures, WatchTower model
| Meeting | Implied rate | vs now | Priced outcome | ||
|---|---|---|---|---|---|
| 3 Nov 2026 | 4.65% | +5bp | cut— | hold— | hike— |
| 8 Dec 2026 | 4.70% | +10bp | cut— | hold— | hike— |
| 2 Feb 2027 | 4.77% | +17bp | cut— | hold— | hike— |
| 16 Mar 2027 | 4.85% | +25bp | cut— | hold— | hike— |
| 4 May 2027 | 4.90% | +30bp | cut— | hold— | hike— |
| 15 Jun 2027 | 4.90% | +30bp | cut— | hold— | hike— |
Implied rate is where the market prices the policy rate after that meeting. The three outcomes are the split for that meeting alone, not cumulative; the one in bold is what the curve leads with. Derived from Exchange-traded futures, WatchTower model.
Bank of Canada
Exchange-traded futures, WatchTower model
| Meeting | Implied rate | vs now | Priced outcome | ||
|---|---|---|---|---|---|
| 28 Oct 2026 | 2.35% | +10bp | cut— | hold— | hike— |
| 9 Dec 2026 | 2.55% | +30bp | cut— | hold— | hike— |
| 27 Jan 2027 | 2.75% | +50bp | cut— | hold— | hike— |
| 3 Mar 2027 | 2.94% | +69bp | cut— | hold— | hike— |
| 28 Apr 2027 | 3.09% | +84bp | cut— | hold— | hike— |
| 2 Jun 2027 | 3.21% | +96bp | cut— | hold— | hike— |
| 21 Jul 2027 | 3.31% | +106bp | cut— | hold— | hike— |
| 8 Sept 2027 | 3.42% | +117bp | cut— | hold— | hike— |
| 27 Oct 2027 | 3.47% | +122bp | cut— | hold— | hike— |
| 8 Dec 2027 | 3.47% | +122bp | cut— | hold— | hike— |
Implied rate is where the market prices the policy rate after that meeting. The three outcomes are the split for that meeting alone, not cumulative; the one in bold is what the curve leads with. Derived from Exchange-traded futures, WatchTower model.
Reserve Bank of New Zealand
Exchange-traded futures, WatchTower model
| Meeting | Implied rate | vs now | Priced outcome | ||
|---|---|---|---|---|---|
| 28 Oct 2026 | 3.00% | +25bp | cut— | hold— | hike— |
| 9 Dec 2026 | 3.24% | +49bp | cut— | hold— | hike— |
| 10 Feb 2027 | 3.44% | +69bp | cut— | hold— | hike— |
| 17 Mar 2027 | 3.62% | +87bp | cut— | hold— | hike— |
| 5 May 2027 | 3.77% | +102bp | cut— | hold— | hike— |
| 16 Jun 2027 | 3.92% | +117bp | cut— | hold— | hike— |
| 4 Aug 2027 | 4.01% | +126bp | cut— | hold— | hike— |
| 15 Sept 2027 | 4.06% | +131bp | cut— | hold— | hike— |
| 27 Oct 2027 | 4.09% | +134bp | cut— | hold— | hike— |
| 8 Dec 2027 | 4.12% | +137bp | cut— | hold— | hike— |
| 9 Feb 2028 | 4.12% | +137bp | cut— | hold— | hike— |
Implied rate is where the market prices the policy rate after that meeting. The three outcomes are the split for that meeting alone, not cumulative; the one in bold is what the curve leads with. Derived from Exchange-traded futures, WatchTower model.
Priced now
What the market expects at the next meeting.
Next up is the Federal Reserve on 28 October, leaning toward a hold.
Updated 1 October 2026. Pricing is given as a band rather than a percentage because this page is cached and a probability moves through the day; the live figure, and the meeting-by-meeting path behind it, are in the terminal.
The curve
Every bank's priced path, on one axis.
Where the market expects each policy rate to sit after every meeting it has priced. Switch to the relative view to compare banks sitting at very different rates: it shows how much is priced between now and each meeting, in basis points, which is the only way a bank at 0.75% and one at 4.00% can be read on the same axis.
Banks with no exchange-traded instrument are not drawn. A flat line for a bank we cannot price would read as the market expecting nothing, which is not the same as us having nothing to show.
The eight banks
Every curve, and the instrument it is built from.
A probability means nothing until you know what produced it. This is the whole table.
Depth
A level, or the whole derivation.
Being straight about it
Where this model is running on an assumption.
Seven of the eight curves are built from futures on the policy rate itself, so there is nothing between the instrument and the rate. New Zealand is different: the liquid contract is on 90-day bank bills, which carry a bank credit spread over the official cash rate. That spread has to be measured and removed before any probability is calculated.
When it cannot be measured, the model uses an assumed figure, and the panel says so: the bank is marked indicative and the assumed figure is in the tooltip. On a 25bp step, a 5bp error in that spread is worth about 20 points of implied probability, which is why it is published rather than buried. A member found this by comparing our reading against his own sources, and the fix and the marking both came from that exchange.
The panels
Seven boards.
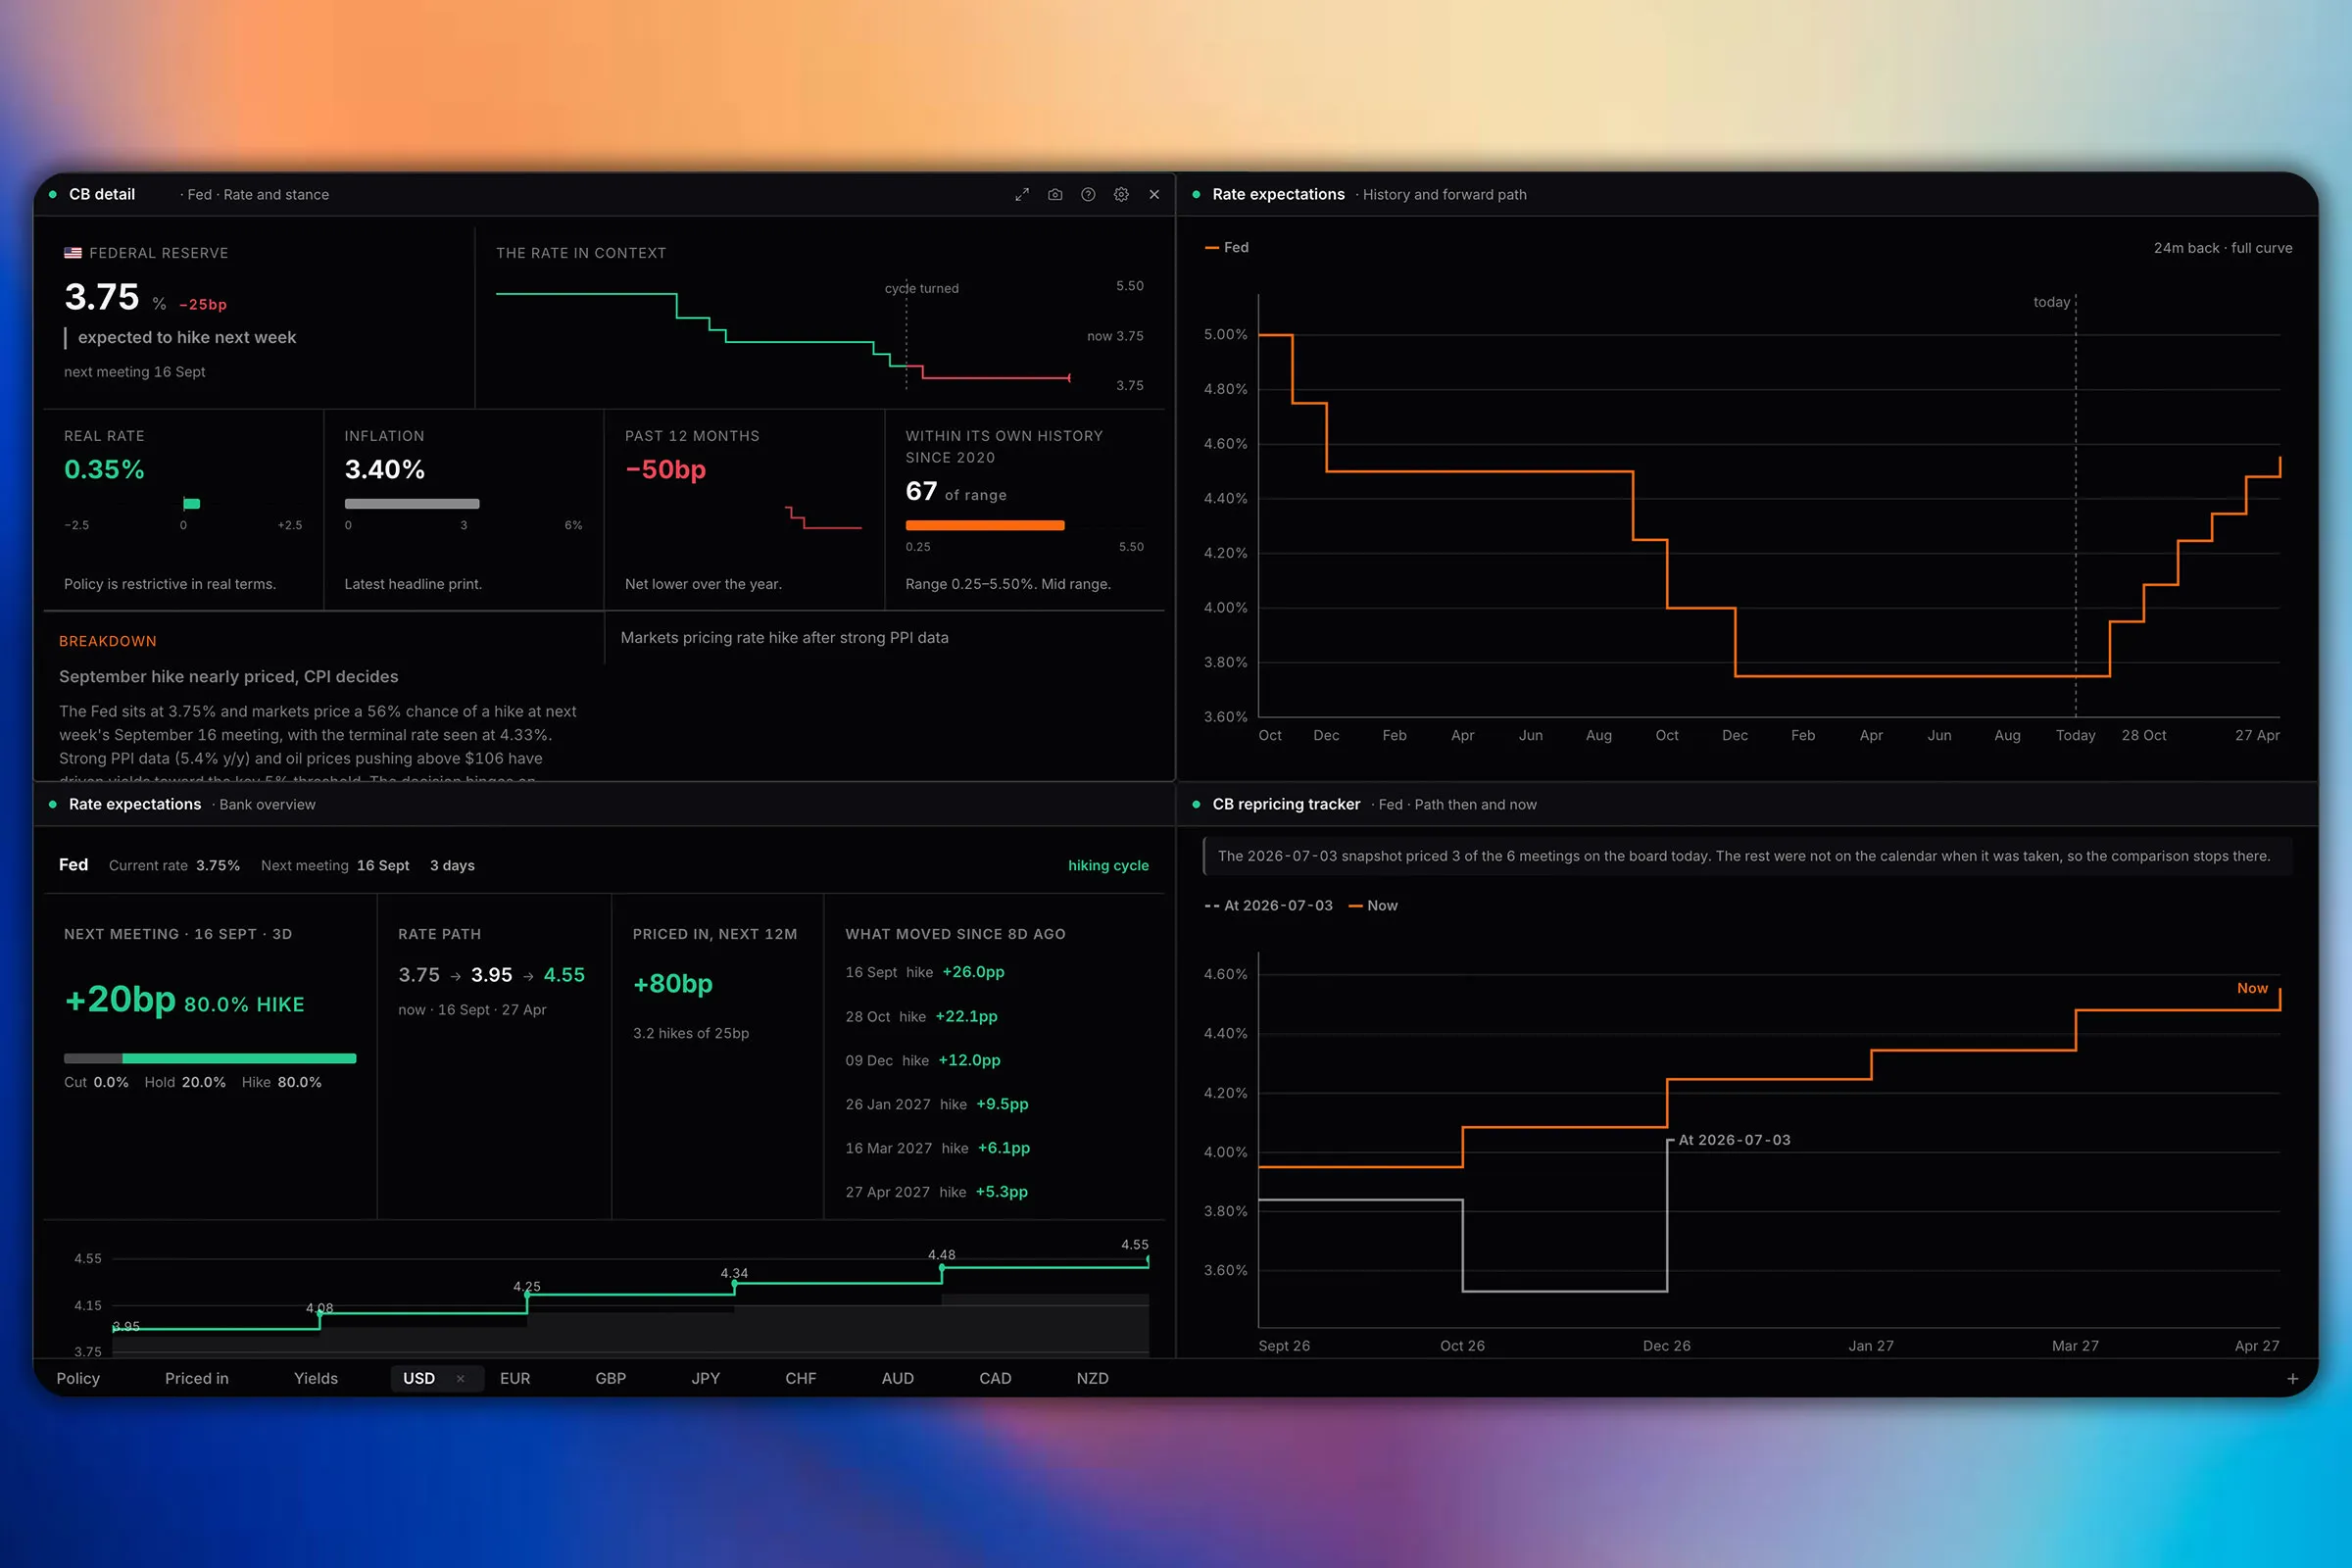
- Rate expectations. What the market expects each bank to do at its next meeting: cut, hold or hike, with the implied level behind each figure rather than the figure alone.
- CB repricing tracker. Which banks the market has repriced most over a chosen window. A repricing is usually what moved the currency, so this is the panel that explains a move after the fact.
- CB rates and stance. Policy rate, real rate, forward stance and next meeting date for the banks you select, on one row each.
- CB detail. One bank in depth: the policy rate, inflation, the real rate and the stance the composite score is reading.
- Hawk to dove ranking. The banks you select ranked from most hawkish to most dovish on one consistent measure, so the comparison is like for like.
- Carry ranking. The rate differential for every pair, long the higher yielder and short the lower, ranked. The rate story expressed as a trade.
- Next meetings. Upcoming decisions ordered by how soon they land, so the diary is on the board rather than in a browser tab.
Rate probability, answered.
How is the probability of a rate cut or hike calculated?
From the step the market prices between one meeting and the next, divided by the size of a policy step. The terminal shows both the marginal probability for a single meeting and the cumulative probability across the path. It is not derived by comparing a forward level against today policy rate, which is a common shortcut that produces figures the arithmetic does not support.
What instrument is each curve built from?
Exchange-traded futures on the relevant overnight or short-term rate, per bank, listed in the table on this page. The instrument matters: a curve built from bank bills carries a credit spread over the policy rate and has to be adjusted into policy space before any of it means anything.
Is the number the most likely outcome or the market level?
The market-implied level from a fitted curve. It is not rounded into policy steps and it is not the modal outcome, so a reading of 2.875% means the curve sits there rather than meaning a 3.00% outcome is expected.
How sensitive is the probability to a small change in the rate?
Very. On a 25bp policy step, a 5bp difference in the implied level is worth roughly 20 percentage points of implied probability. That is why the instrument and any adjustment applied to it are published here rather than hidden, and why a reading that does not survive a realistic wobble in that adjustment is marked as fragile.
How often does it update?
The model re-runs on a schedule and also when a policy rate actually changes, so the anchor cannot sit at a stale rate after a decision.
Is any of this free?
The free plan carries 32 of the 103 panels across 2 boards, and which ones is listed on the pricing page. Everything else is on Pro at $49 a month.