Features
98 widgets. 15 categories. All of them named below.
Most tools describe their features. This page names every panel in the terminal and says what it does, because a list you can check is worth more than a page of adjectives.
- 98
- Widgets in the library
- 15
- Categories
- 55
- Free, no card
- 24
- Markets scored
- 48
- Institutions read
The tracked universe
Named in full, so you can check it against what you trade.
9
Currencies
USD, EUR, GBP, JPY, CHF, AUD, CAD, NZD, MXN
6
Metals and energy
Gold, silver, platinum, palladium, copper, WTI
9
Equity indices
S&P 500, Nasdaq 100, Dow, DAX, FTSE, CAC, Euro Stoxx, IBEX, Nikkei
8
Central banks
Fed, ECB, BoE, BoJ, SNB, RBA, BoC, RBNZ
Scores and bias
One number per market, and the whole derivation.
Every market carries a composite score from 0 to 100 on published weights. 56 and above reads bullish, below 45 reads bearish, and the band between the two is neutral. The scale reads the same way on all 24 assets.
The score opens into its components, each readable on its own, with the written narrative and the history of how it has moved. The pair heatmap scores every G10 pairing against every other in one grid, and the conviction check reads your open positions against it and says plainly when you are positioned against your own analysis.
Bank research
48 institutions, read and made comparable.
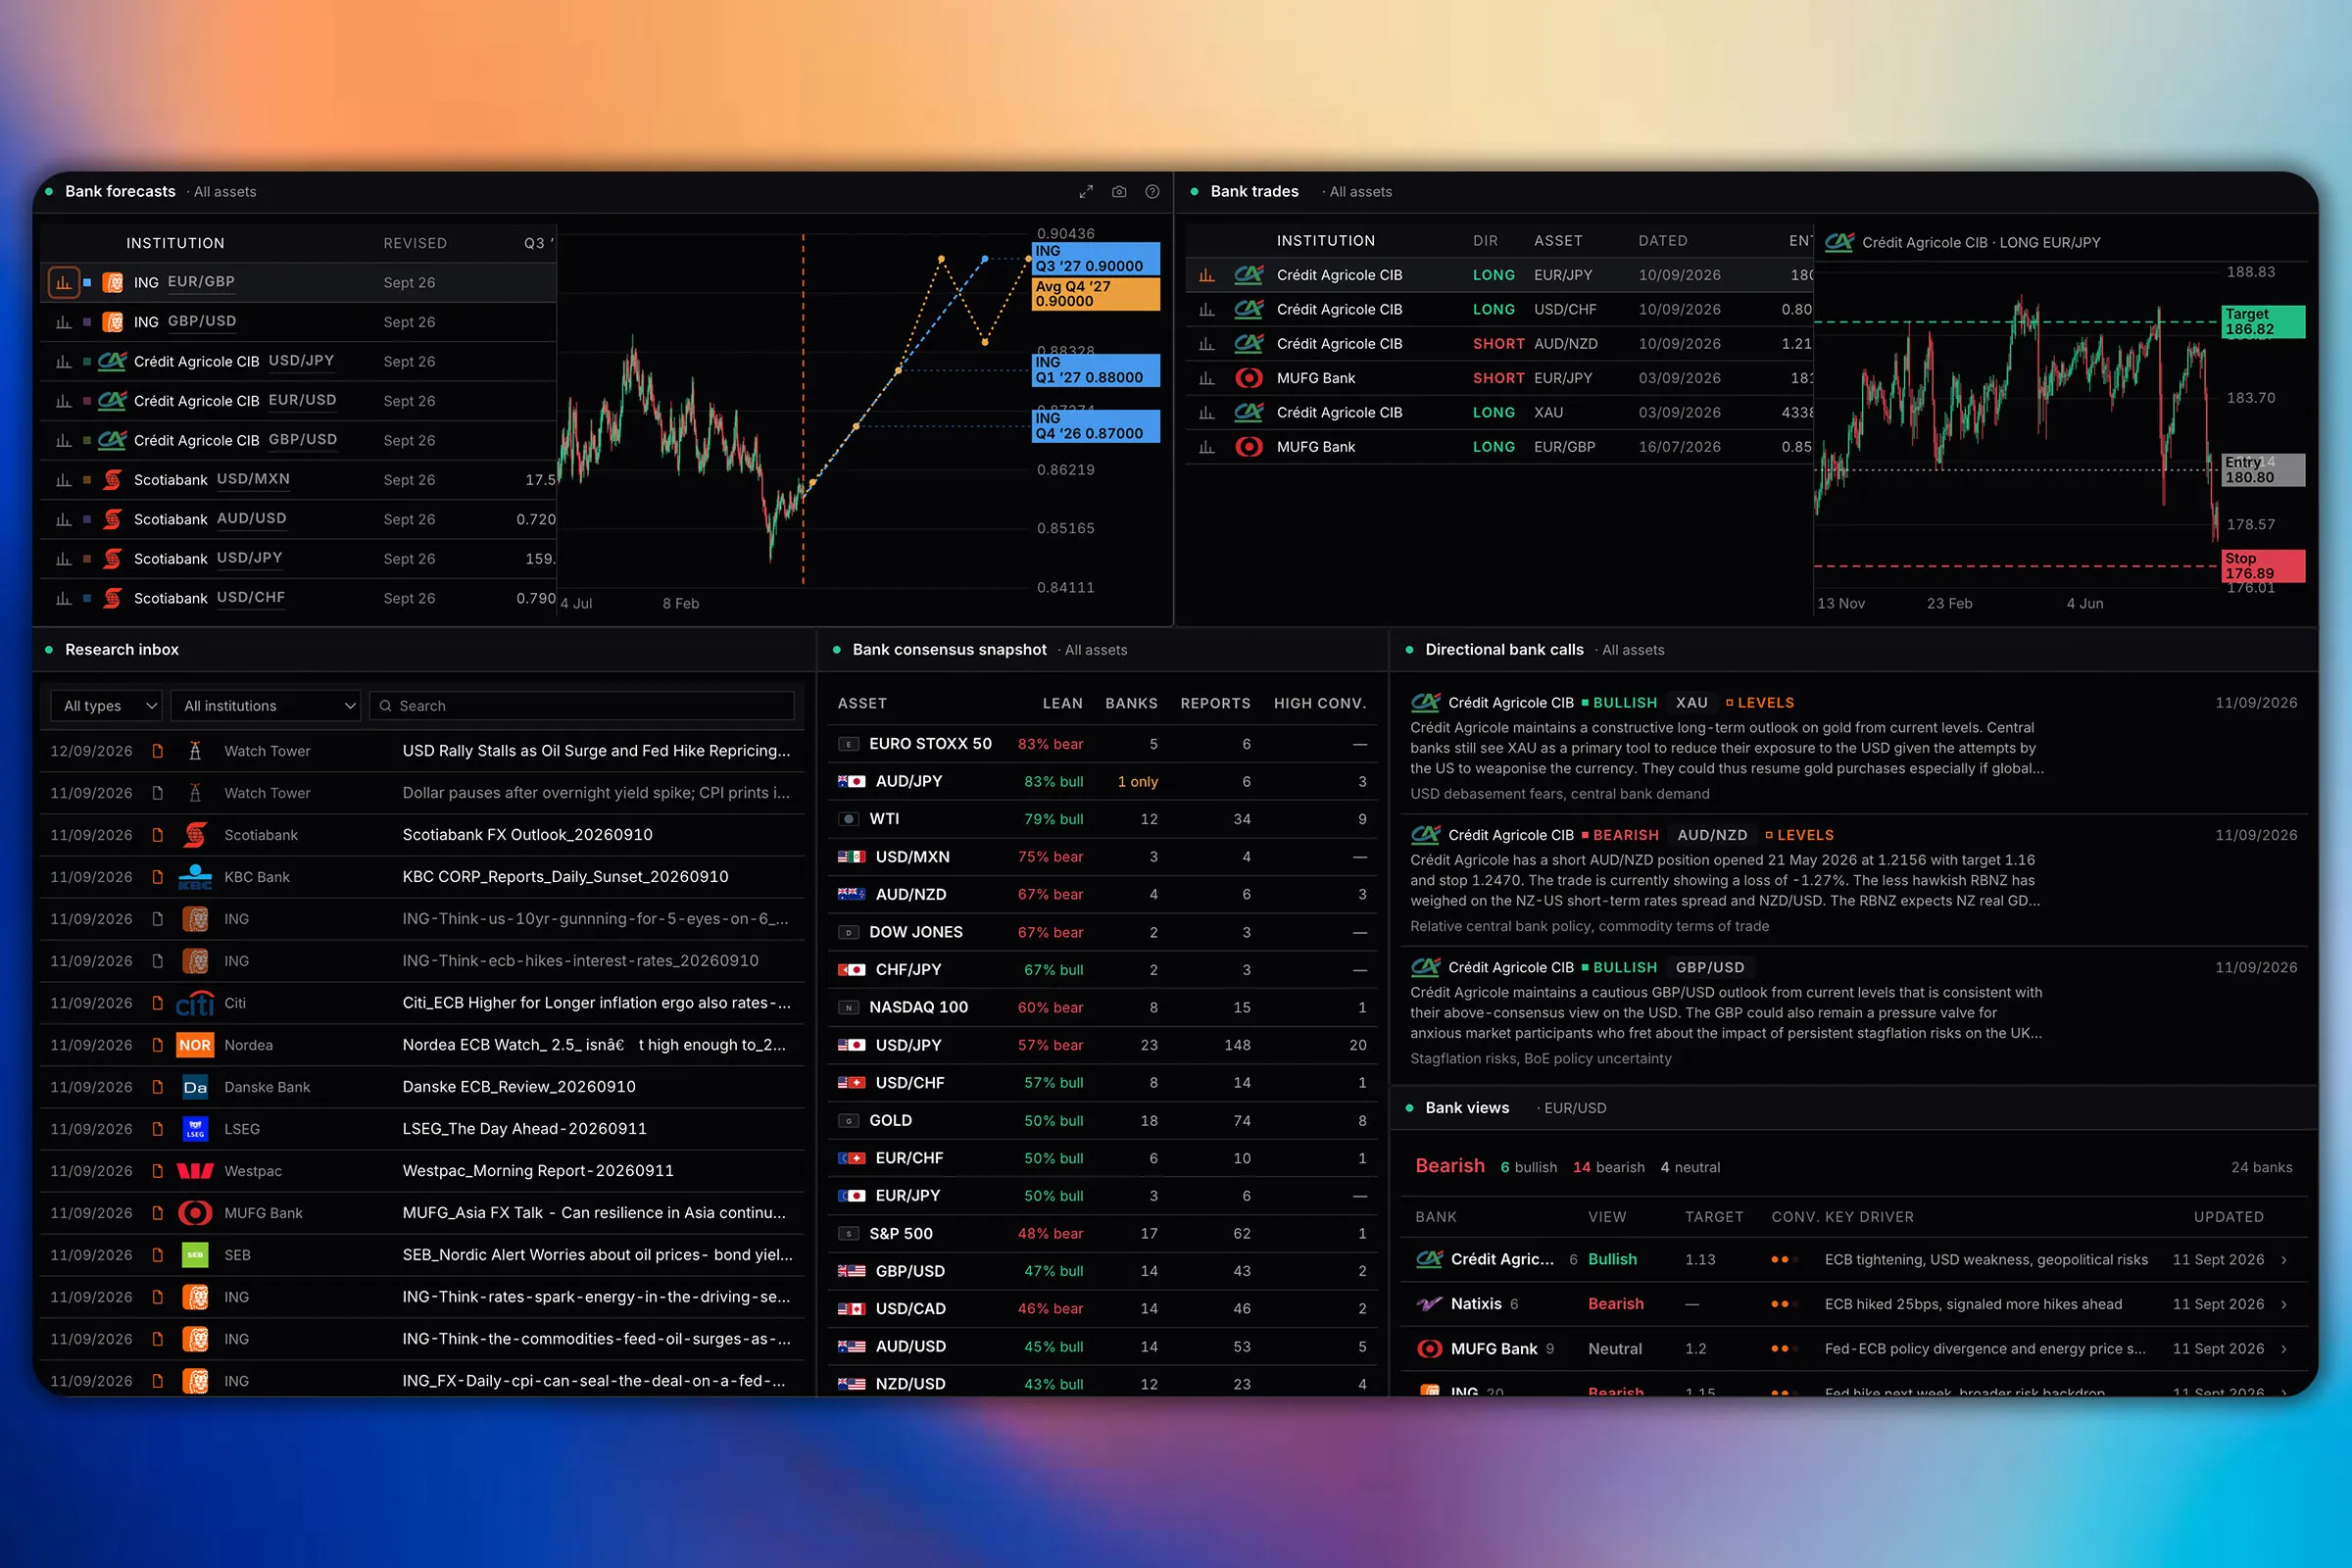
The original reports are indexed by institution and date and stay readable inline, so nothing is summarised away. On top of them, each report is reduced to its thesis, direction, conviction, price target and horizon.
That is what makes them comparable. You get the consensus across desks, the outliers, and which houses have quietly shifted this week. A 100% bullish consensus is a different signal from a 6 to 5 split, and the terminal shows you which one you are looking at.
Central banks and rates
The path the market is pricing, not the one already announced.
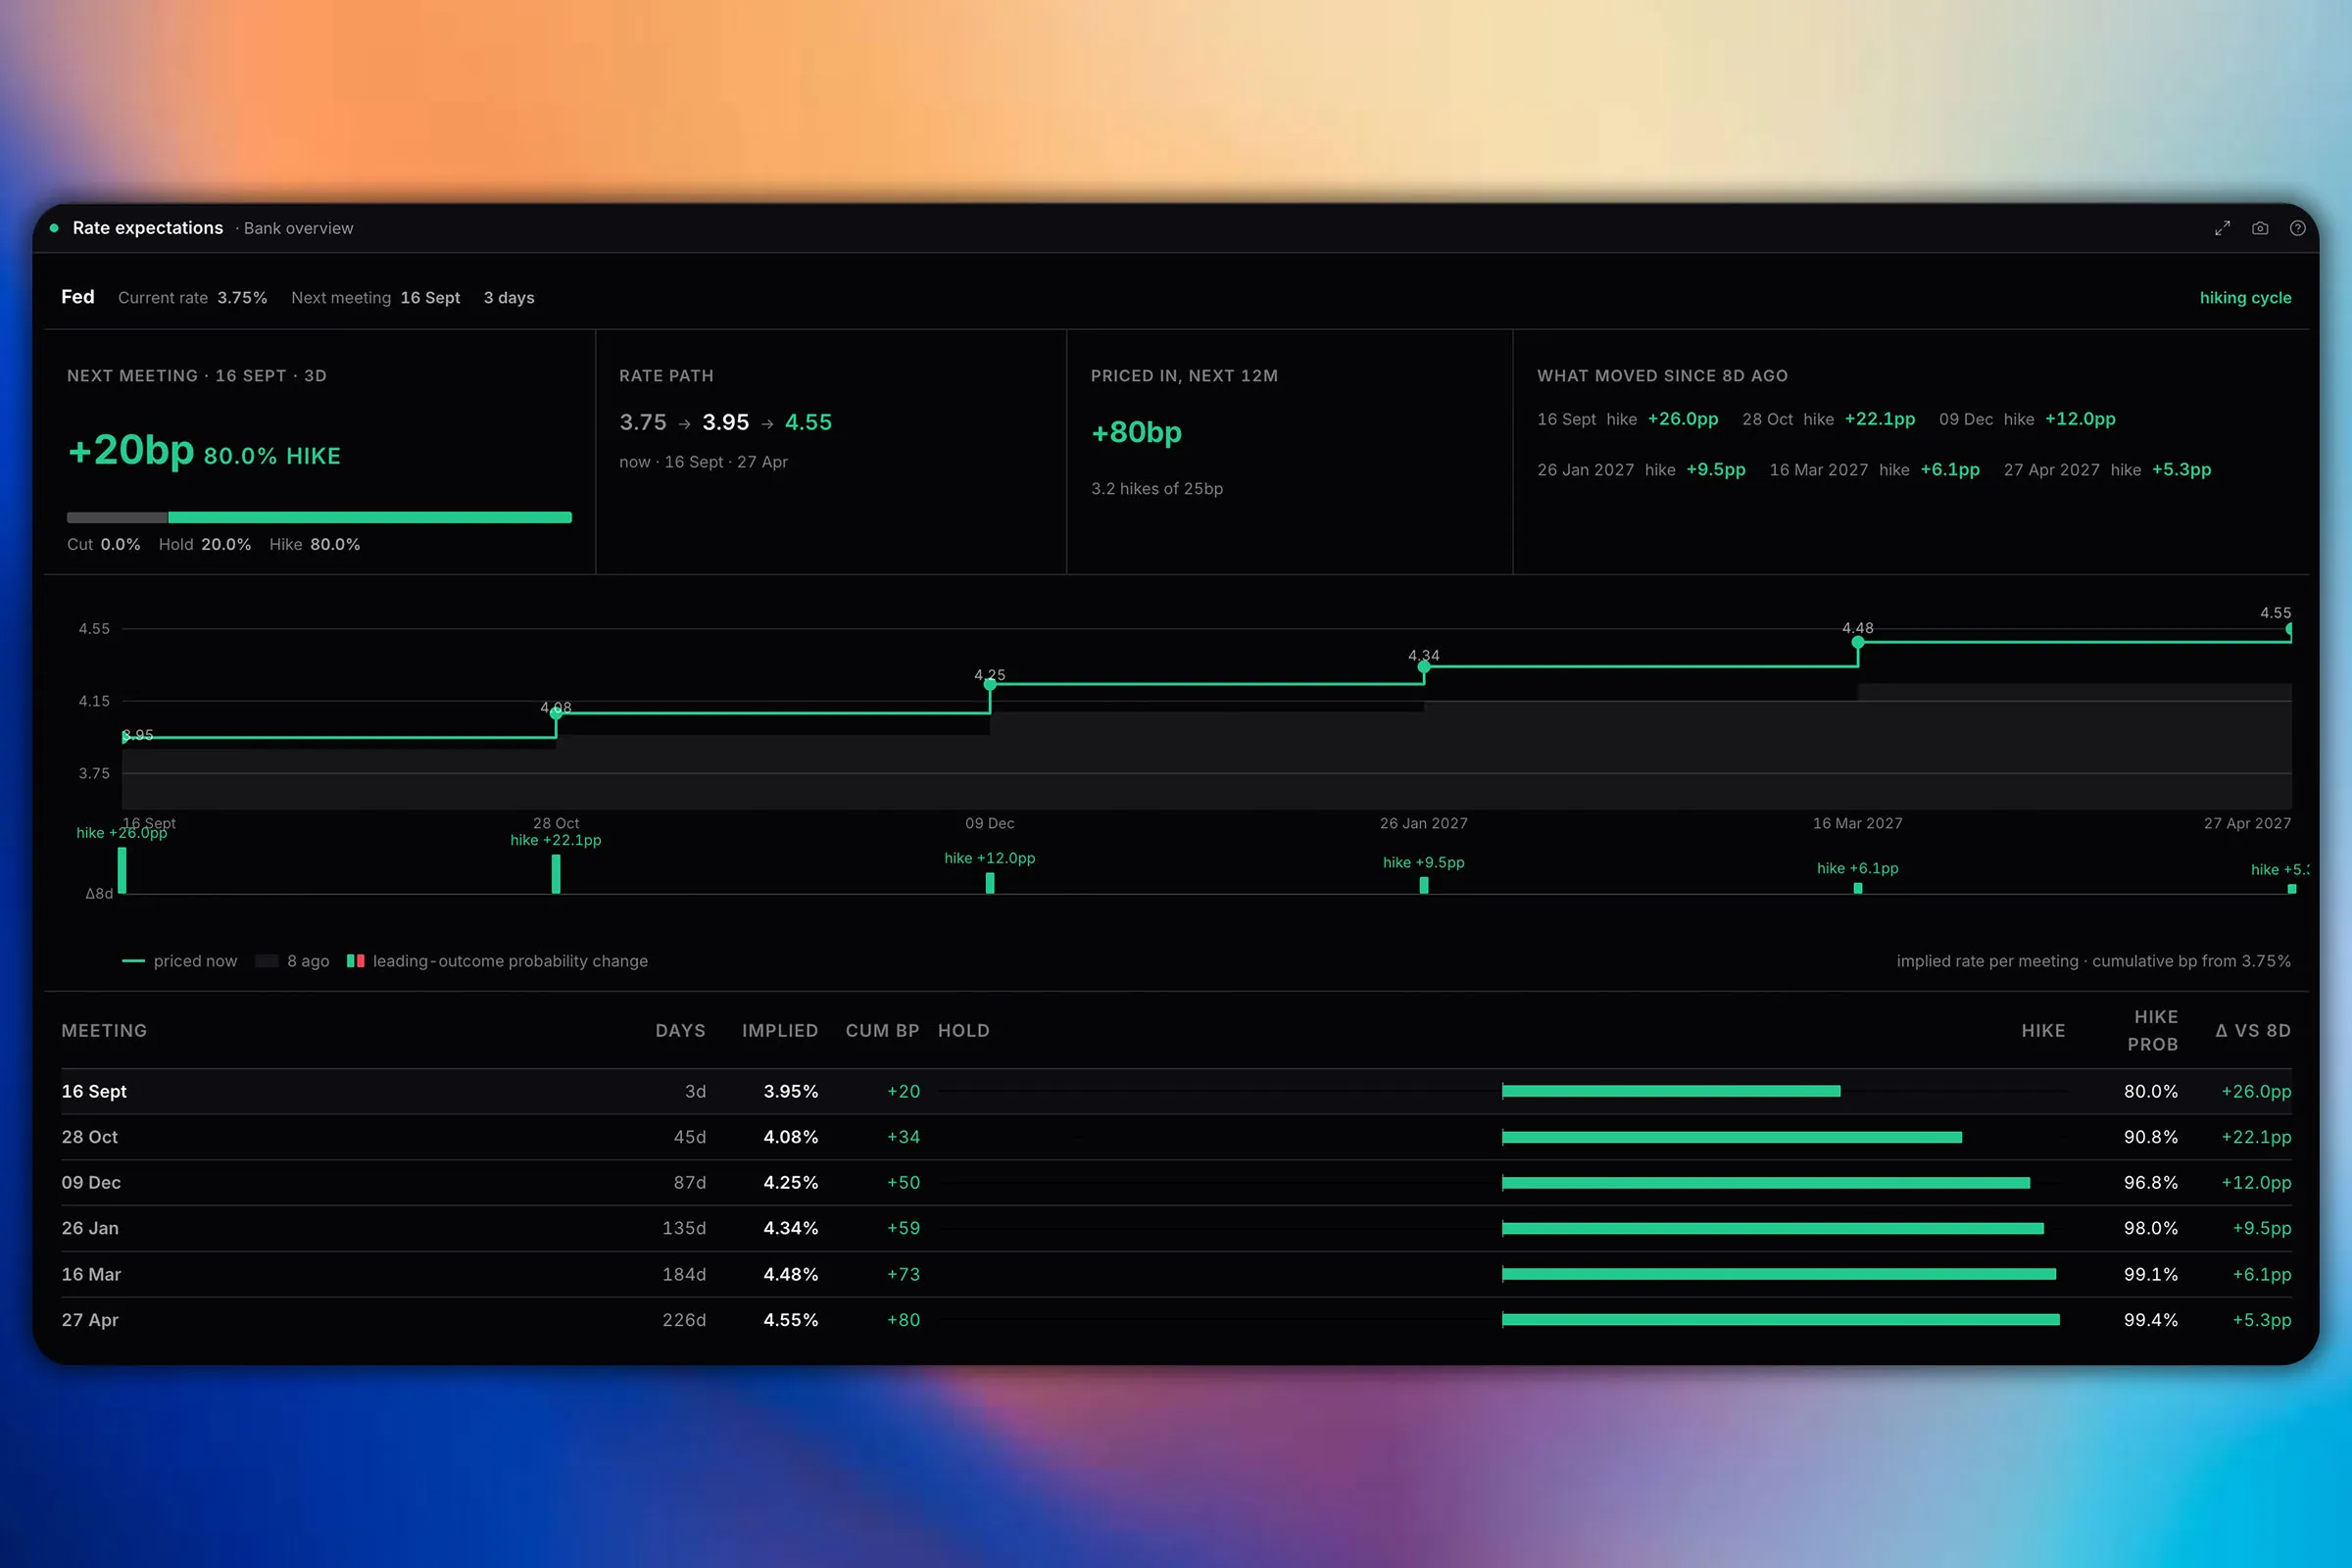
8 central banks tracked on stance, policy rate, real rate and distance from neutral. The market implied path reprices as futures move rather than waking up on meeting day, so you get the next implied rate and the terminal rate as they change.
The rate differential matrix compares every bank against every other and calls out the widest spreads, which is where a carry or differential trade starts. Treasury yields, the curve and real yields sit alongside, and they are free: the US Treasury publishes them, so charging for them would make the locks that are earned look arbitrary too.
The workspace
Arrange all 98 of them however you work.
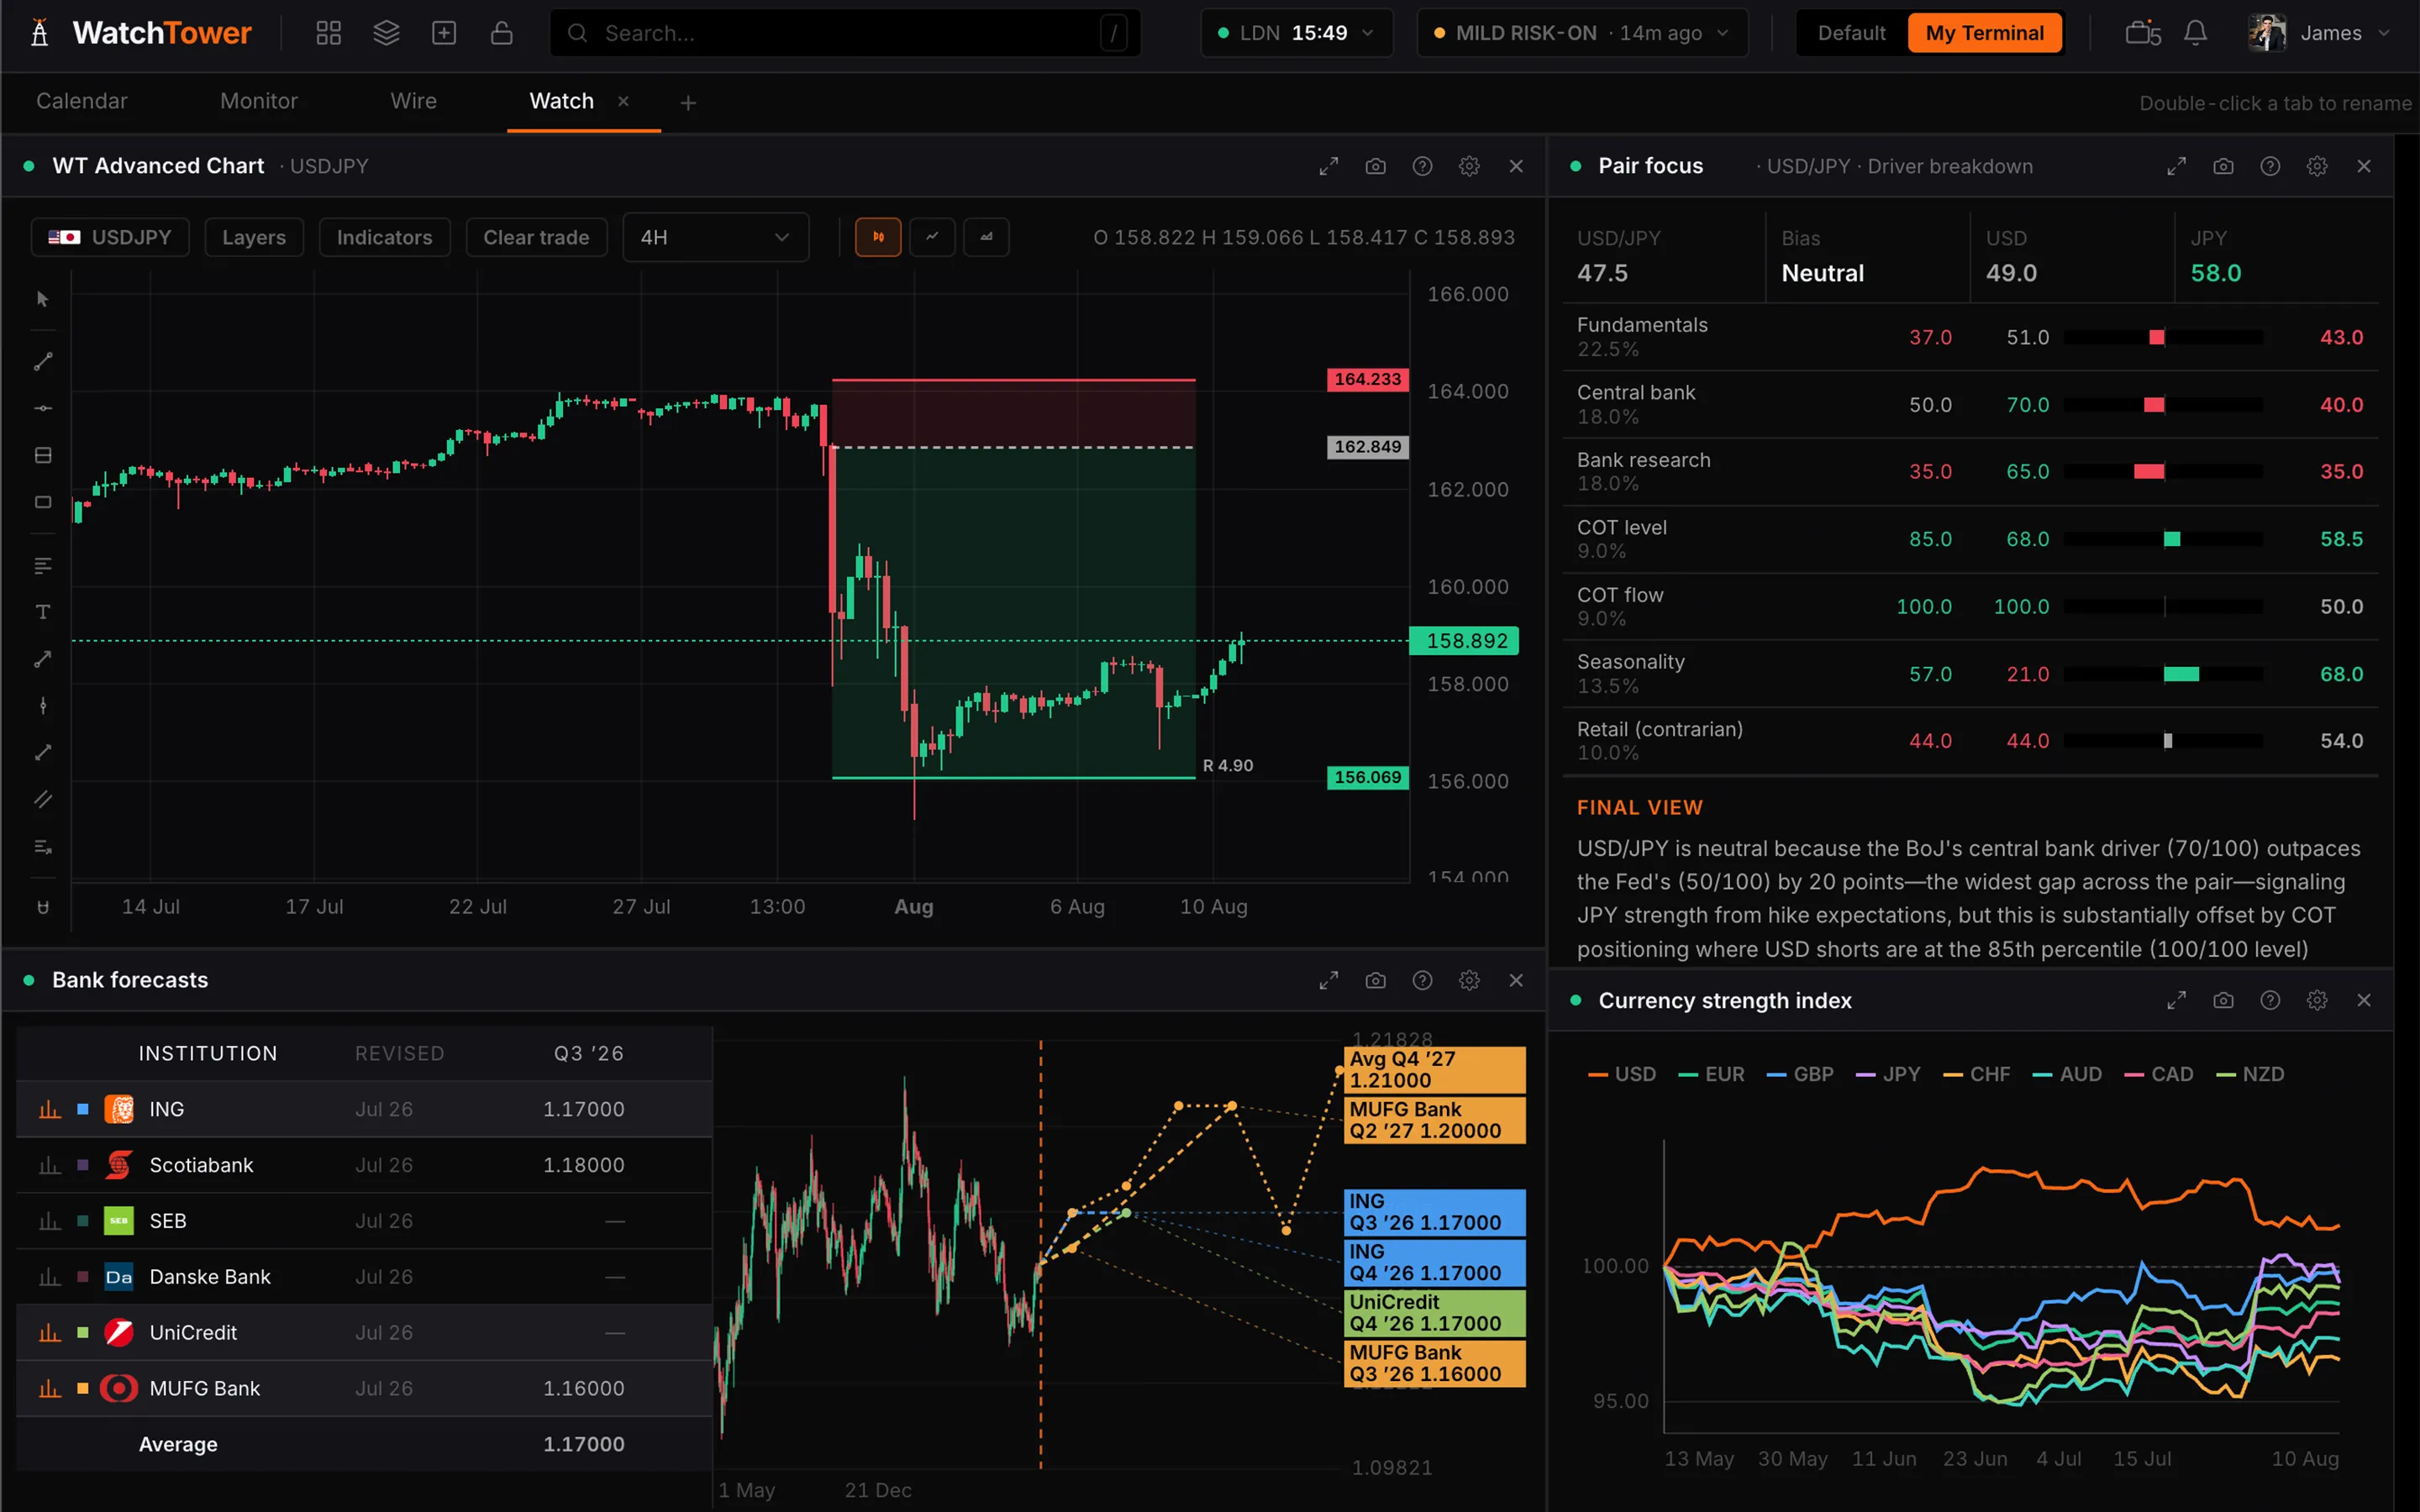
A free account builds 2 boards from the 55 widgets it carries. My Terminal lifts both limits: the full library, an empty grid, and as many workspaces as you need. Drag in what you use, size it, name the tabs.
It follows you across devices and stays as you left it. Board lock freezes a layout you are happy with, and a full hotkey system moves you around without reaching for the mouse.
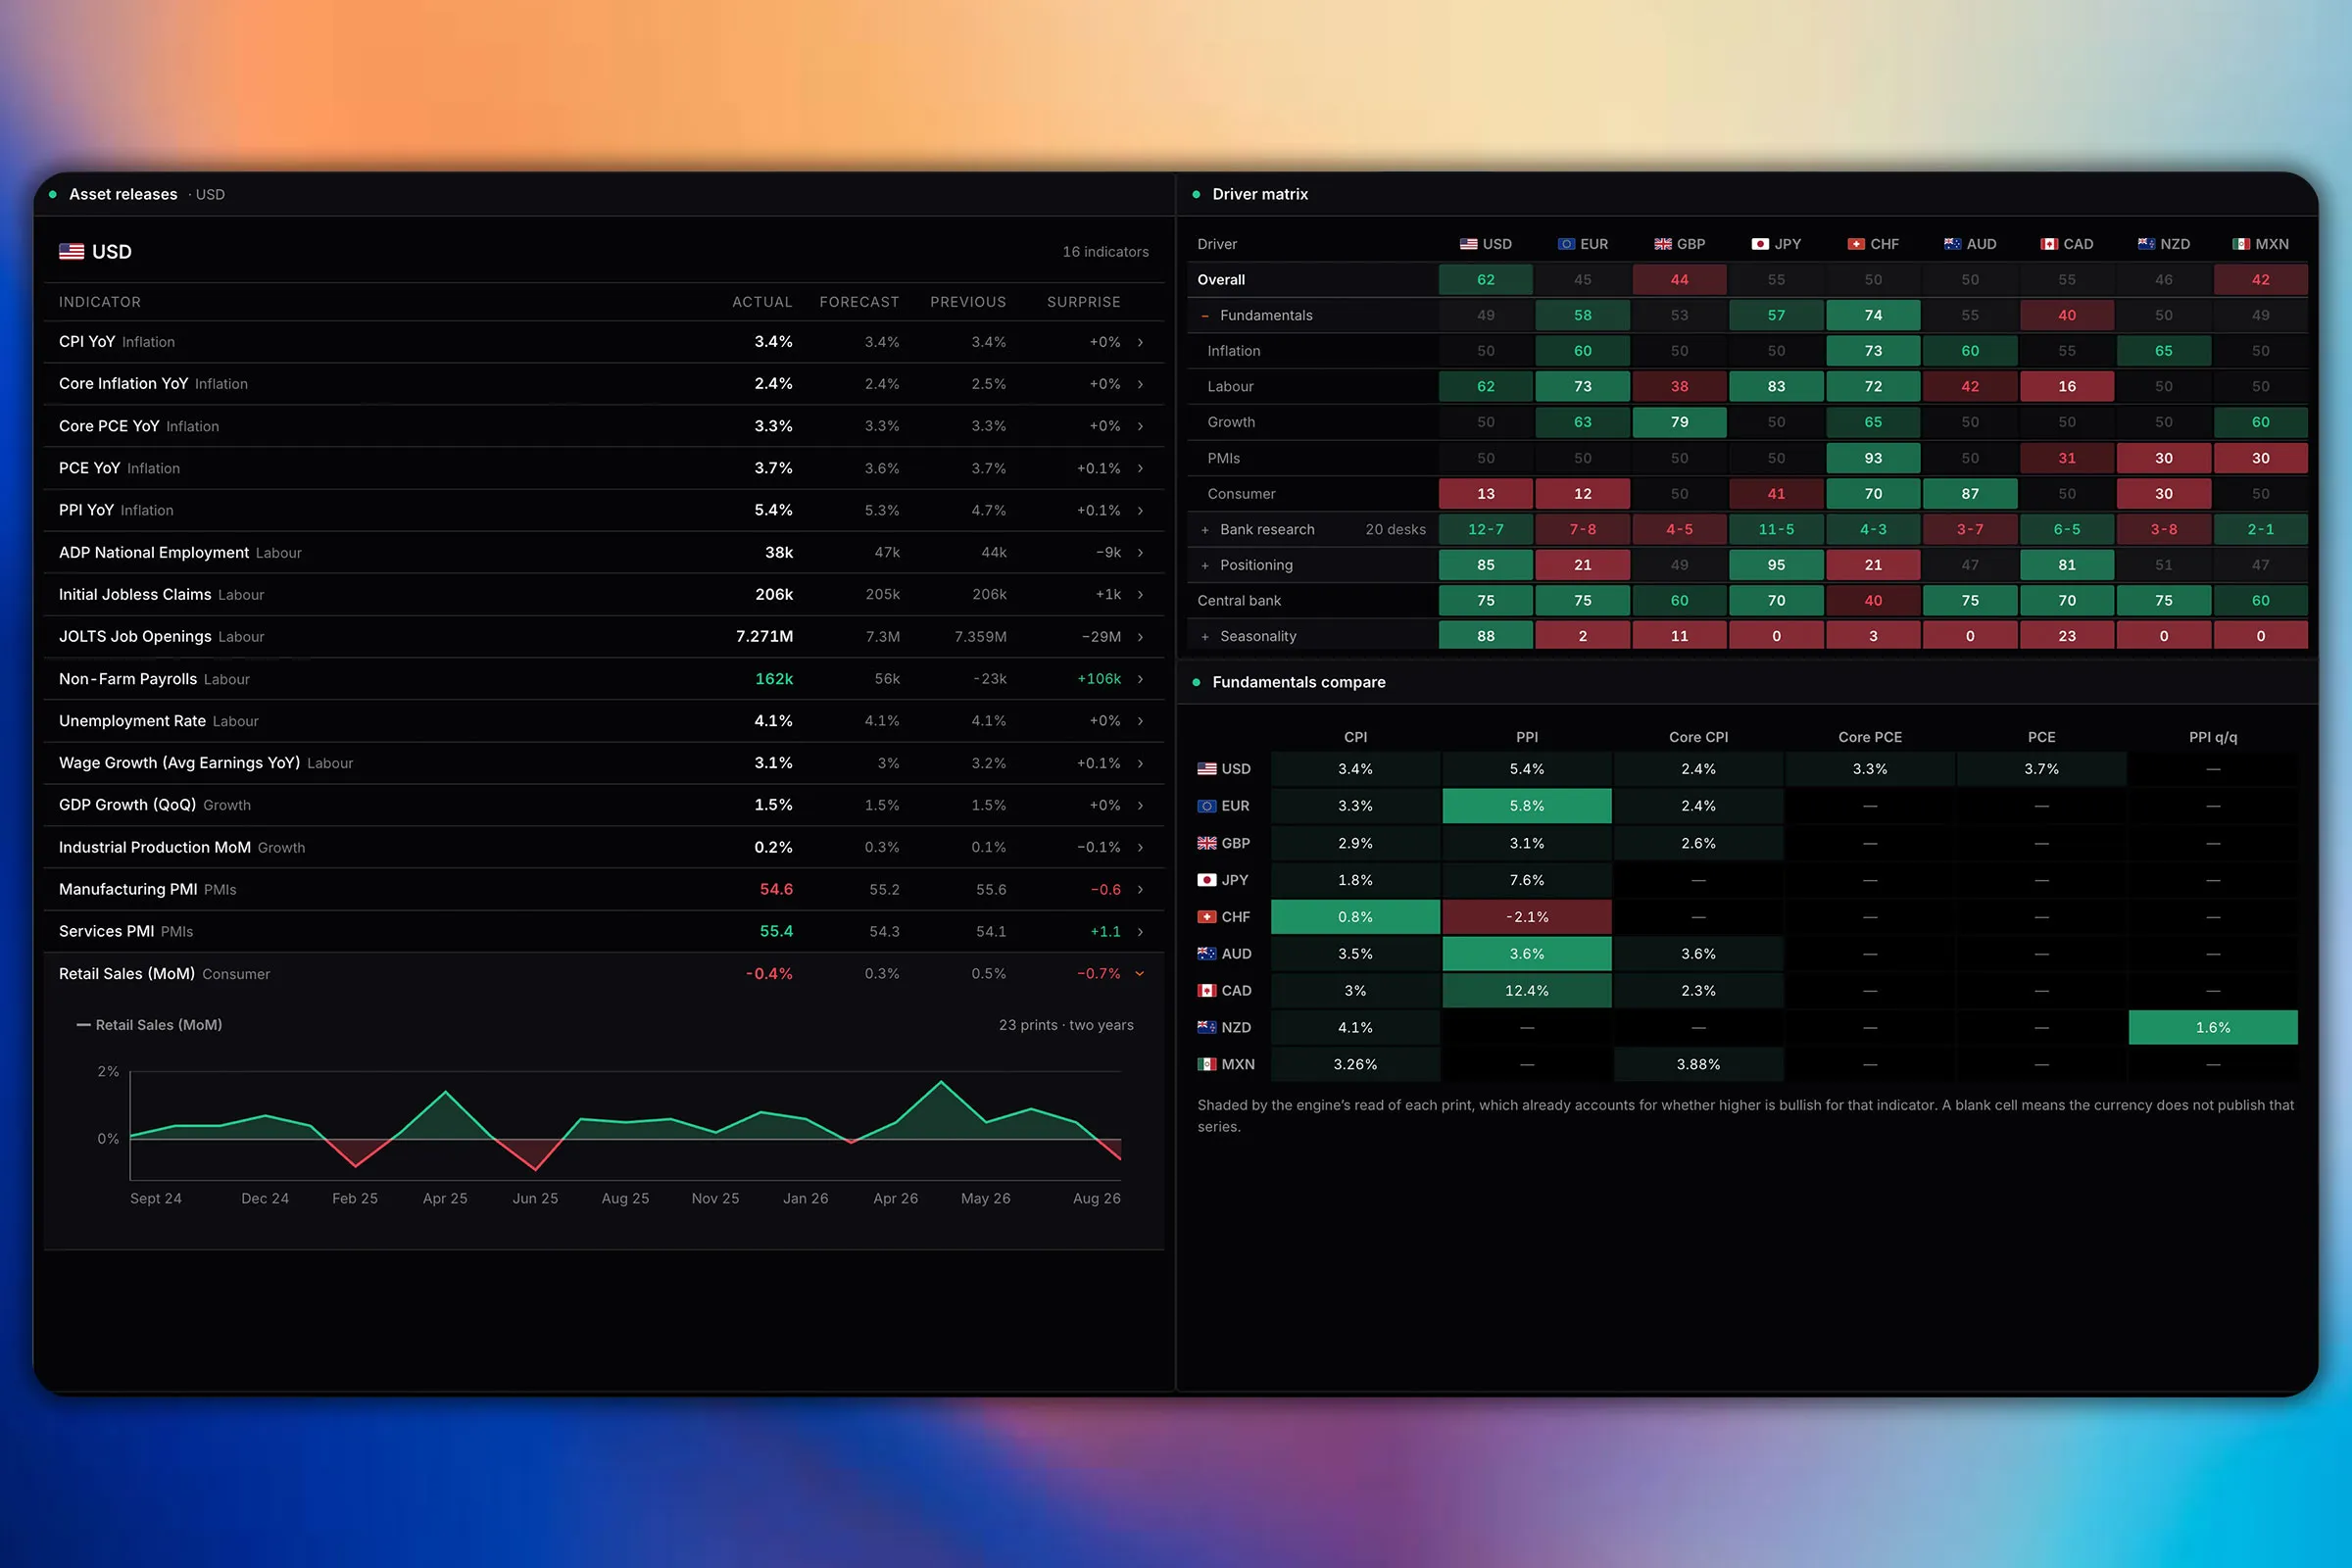
Macro data
Every release, against what was expected.
The macro matrix puts every print against consensus and previous with the surprise measured, across inflation, labour, growth, PMIs and consumer. 24 months of history sits behind each one.
A miss shows as a break in trend rather than a single red number, which is usually where a macro thesis starts to fail and the part most traders find out about last.
Seasonality
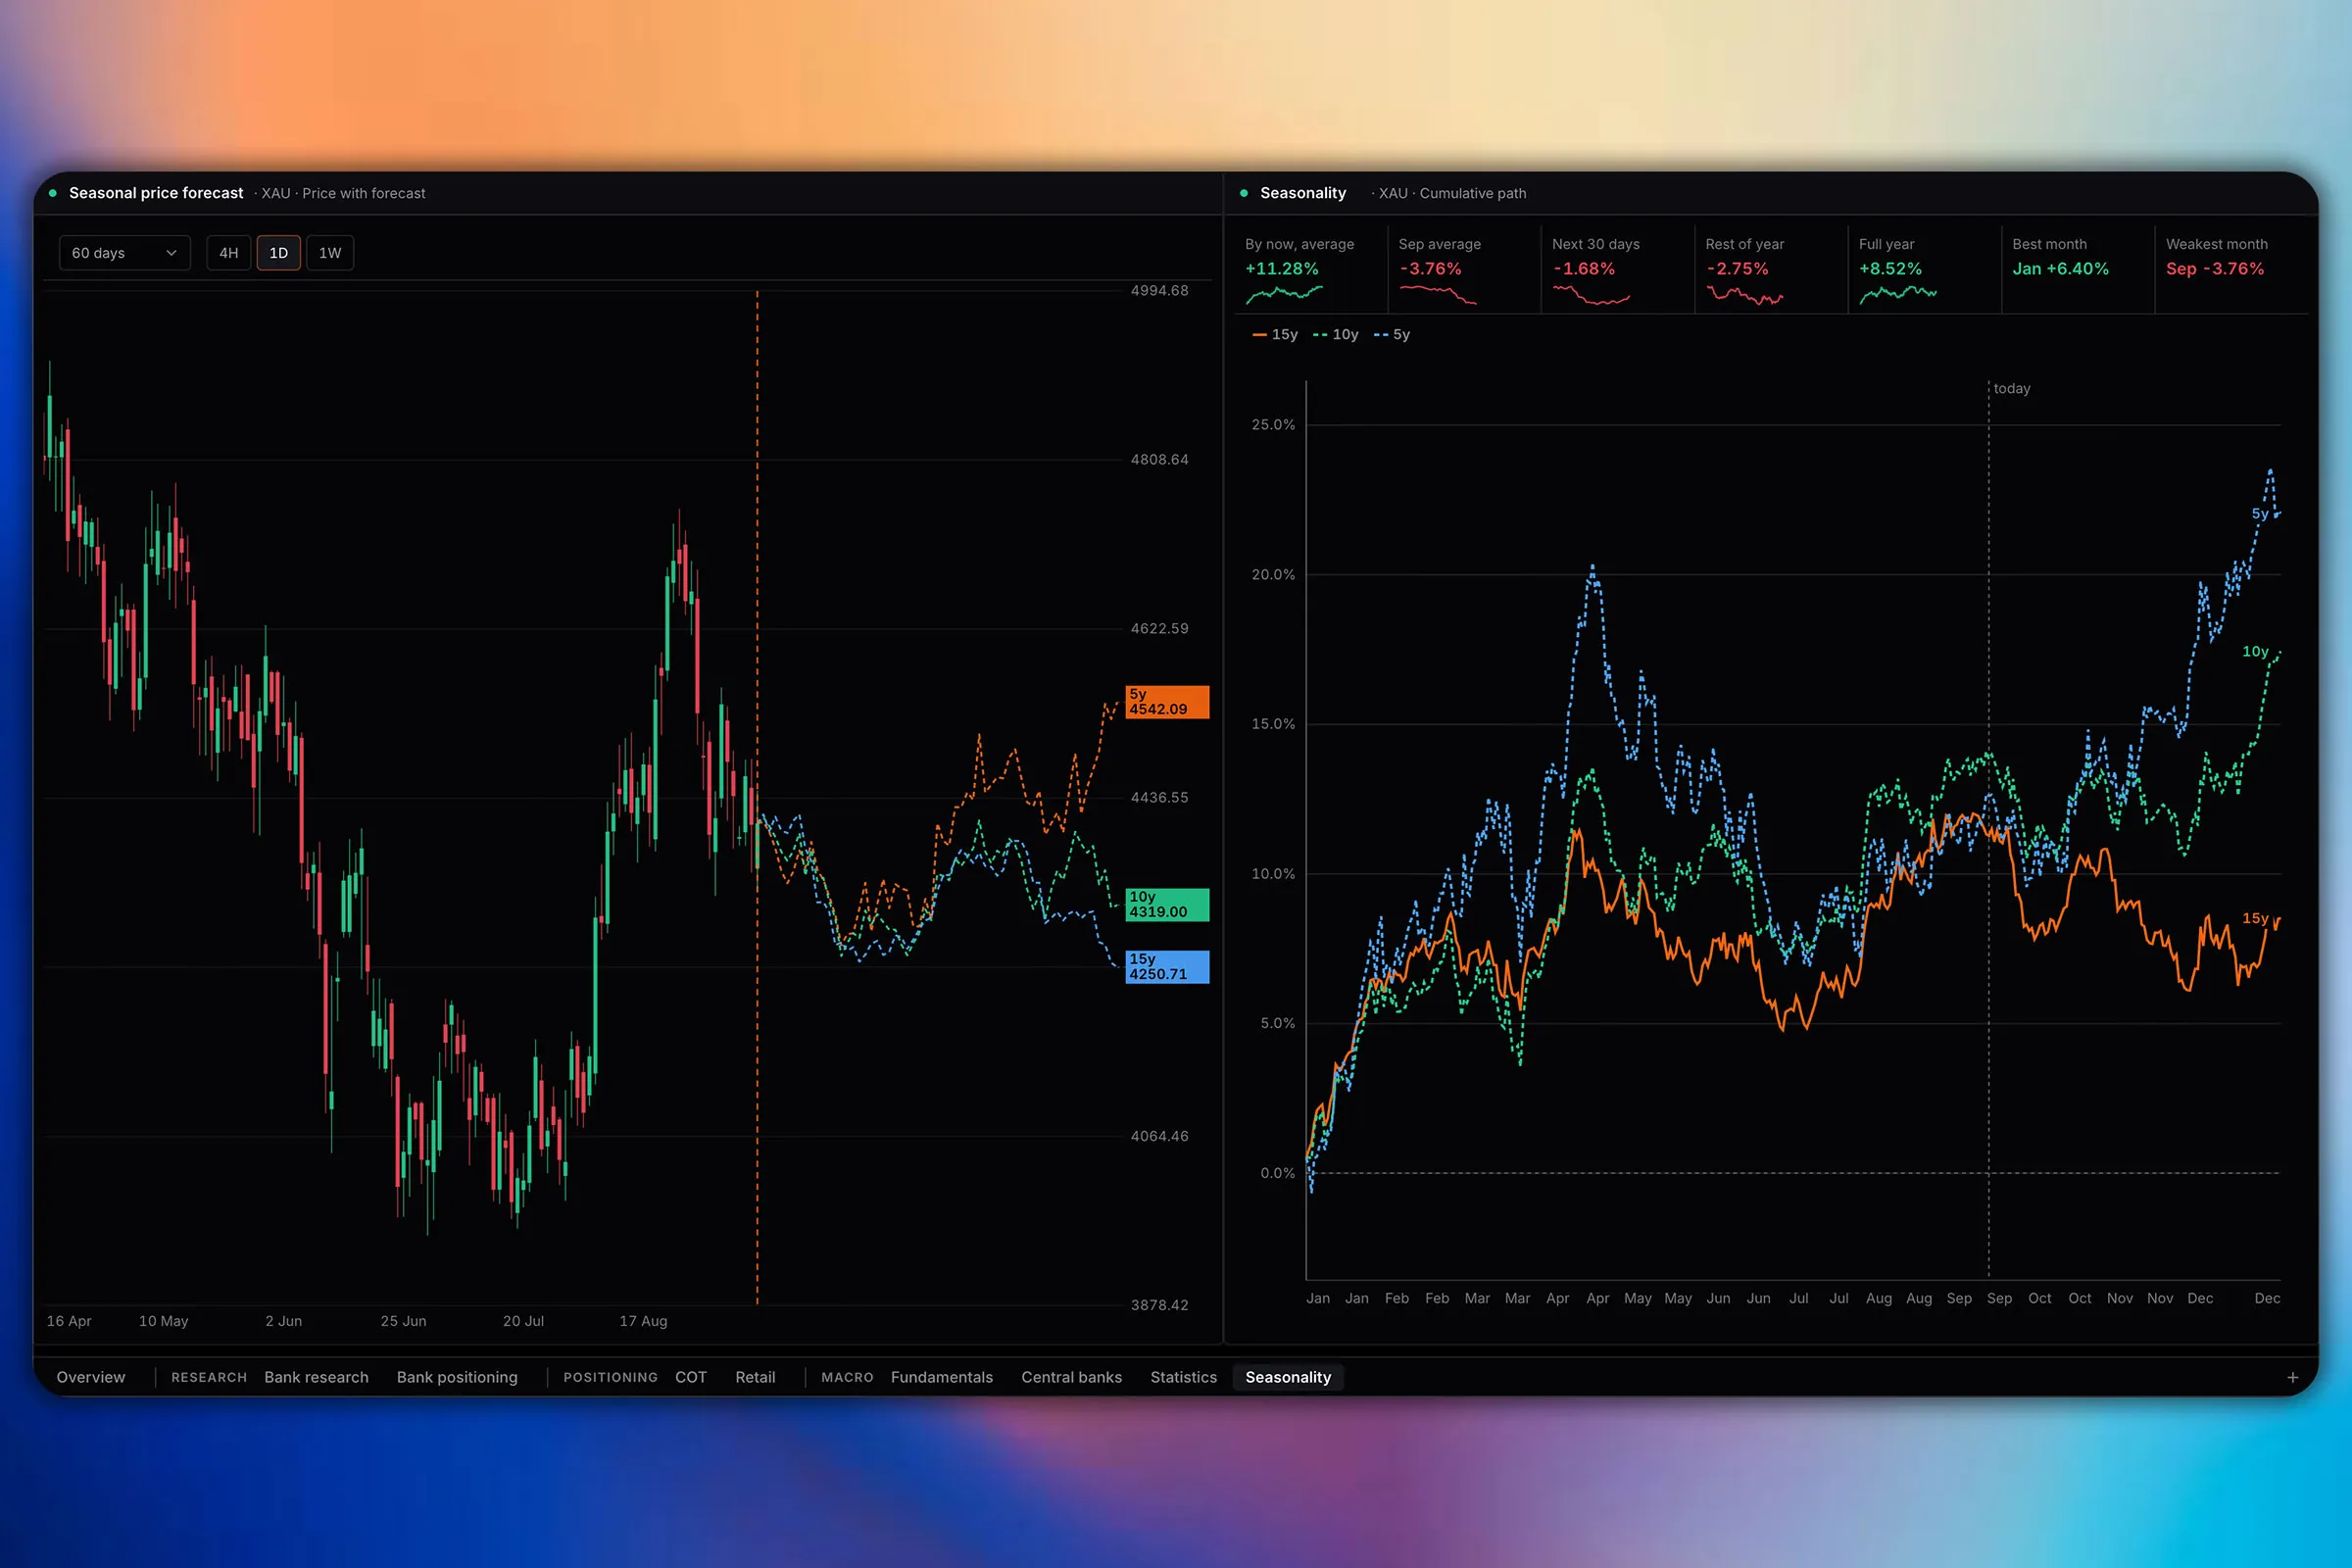
What this market usually does at this point in the year.
Historical tendency by month and by week, with the forward path drawn out, so a seasonal skew is visible as a distribution rather than an average. It carries a defined share of the composite score.
Useful mainly as a tiebreaker: a setup that agrees with a strong seasonal is a different proposition from one fighting it.
News and geopolitics
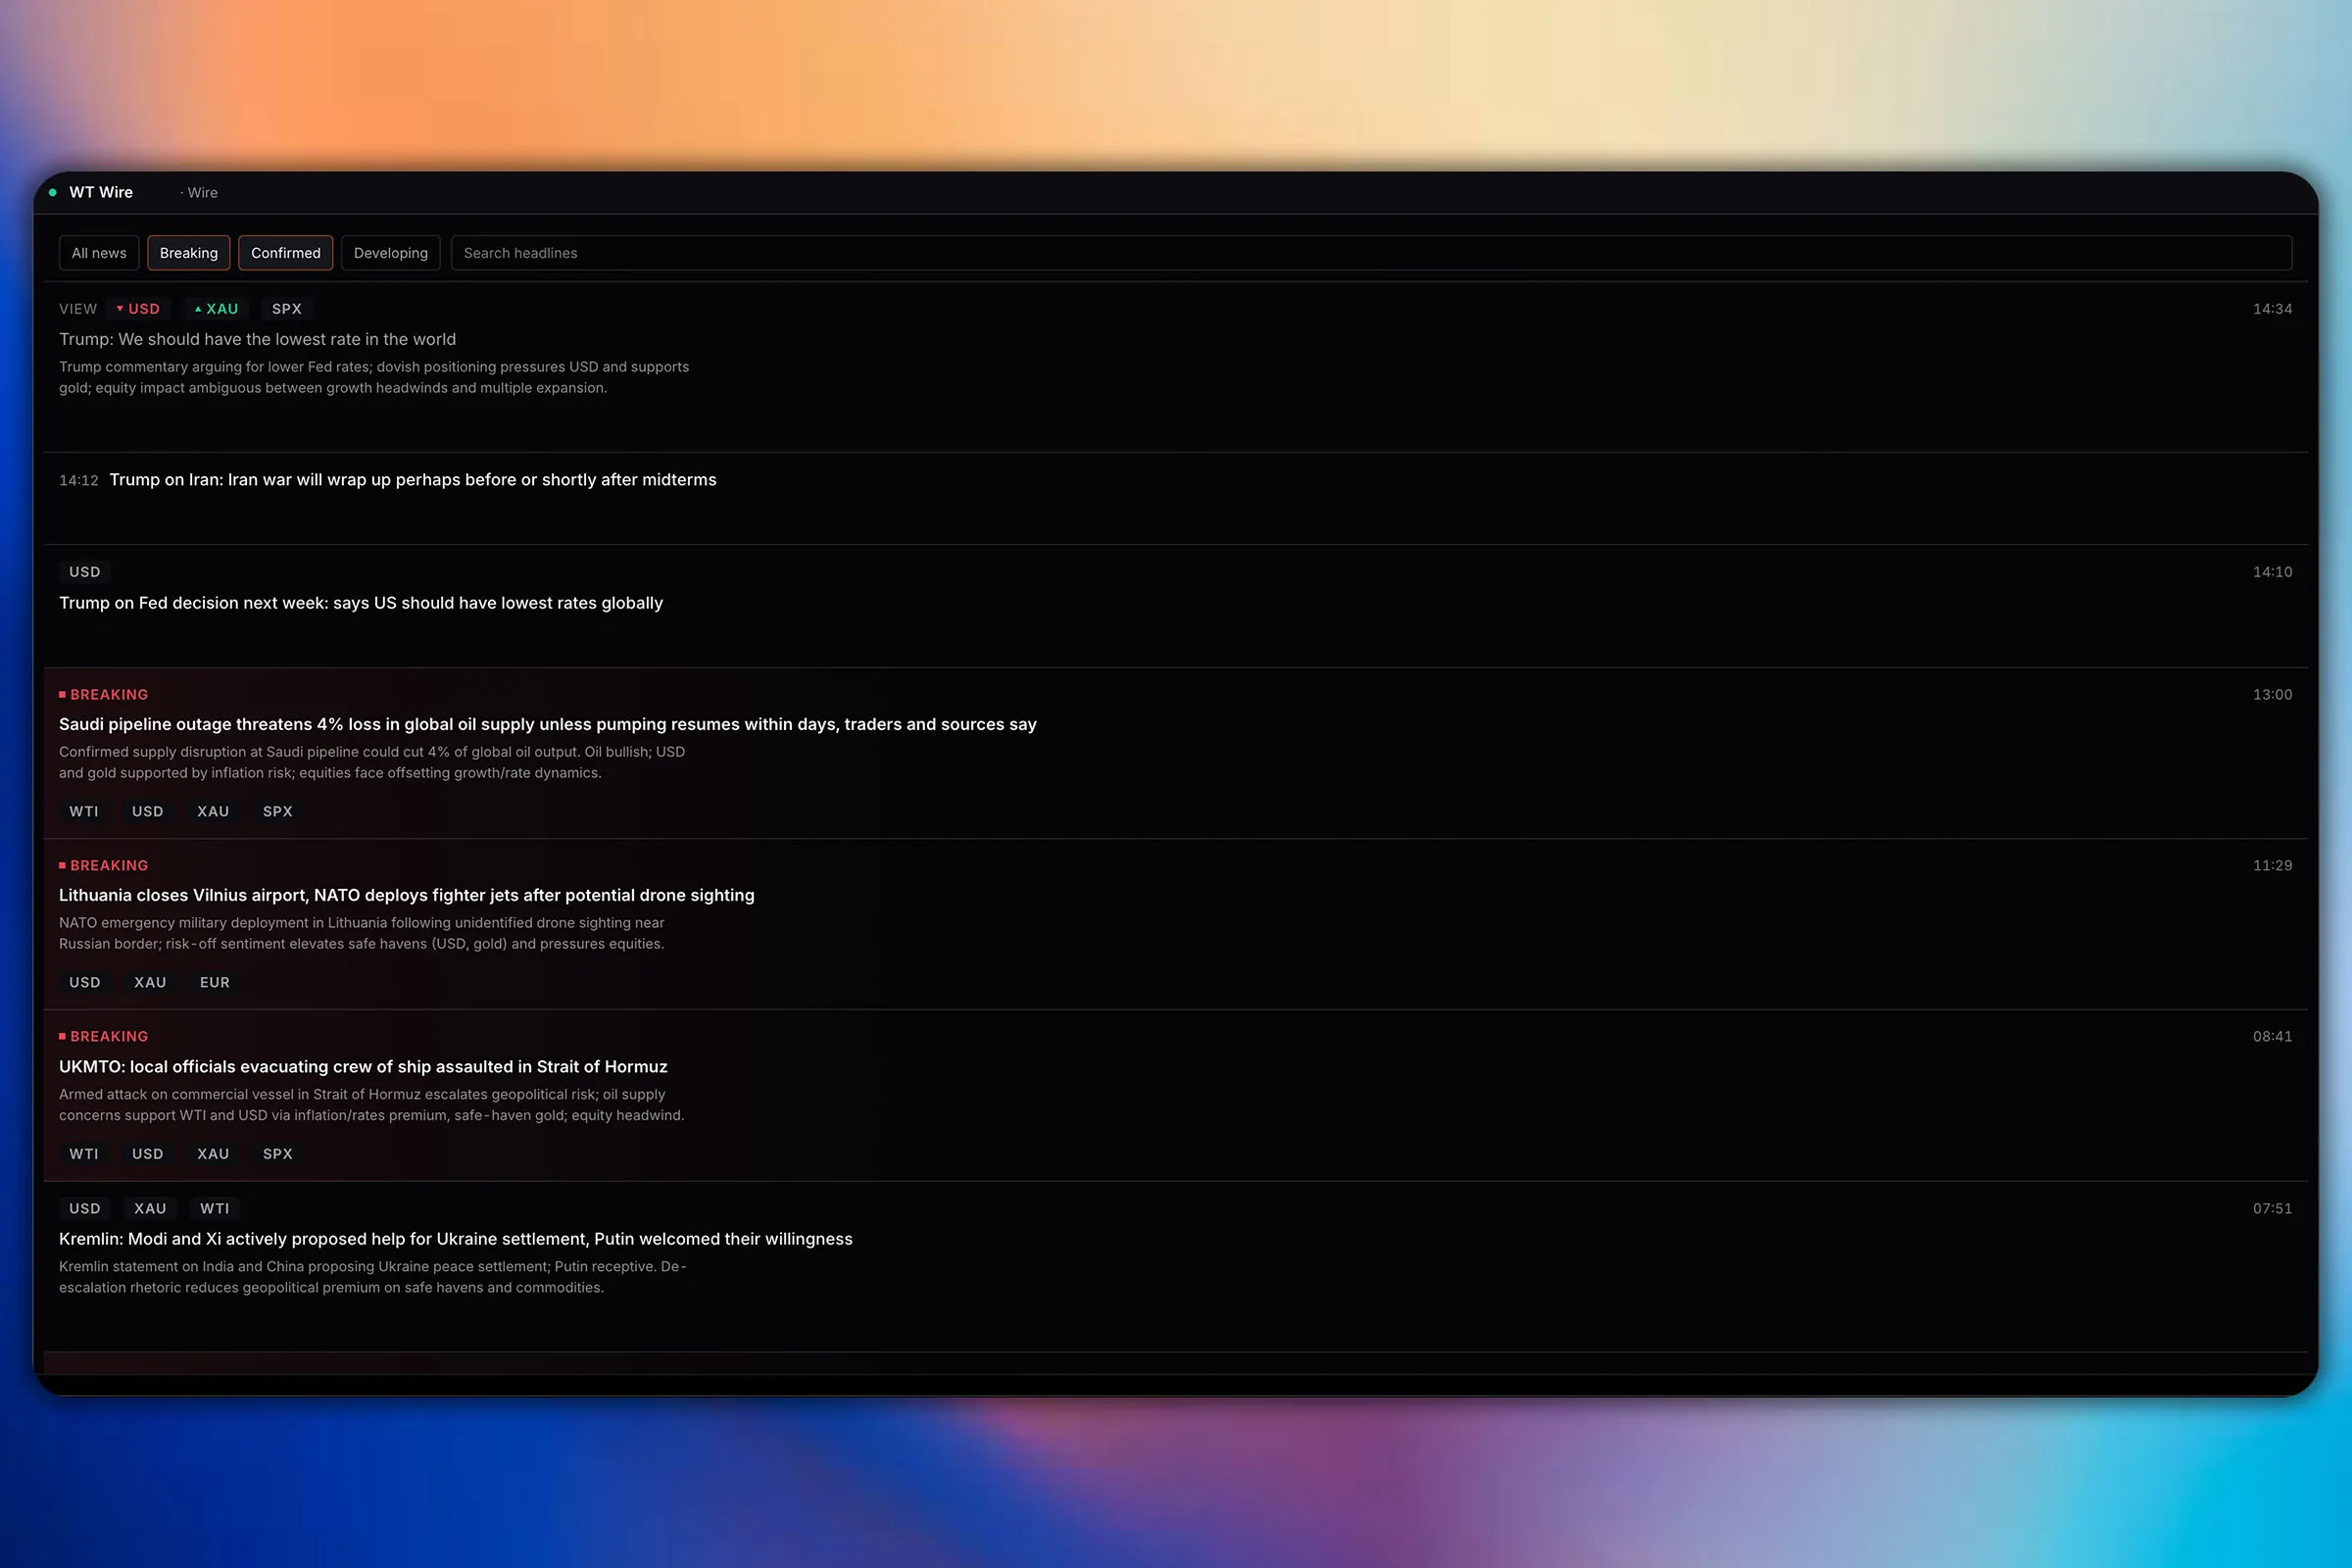
Headlines that have been checked before they reach you.
The WT Wire cross-checks each headline across sources and tiers it as confirmed, official or developing, so a market-moving event reads differently from an unverified rumour at a glance.
The situation monitor tracks running geopolitical events as situations rather than a stream of disconnected headlines, which is the difference between knowing a shipping lane is closed and reading 40 separate updates about it. The situation monitor is part of Pro. The wire is free: it is the clearest thing here that a charting site does not have, and there is no sense describing it to somebody who could be reading it.
Charting
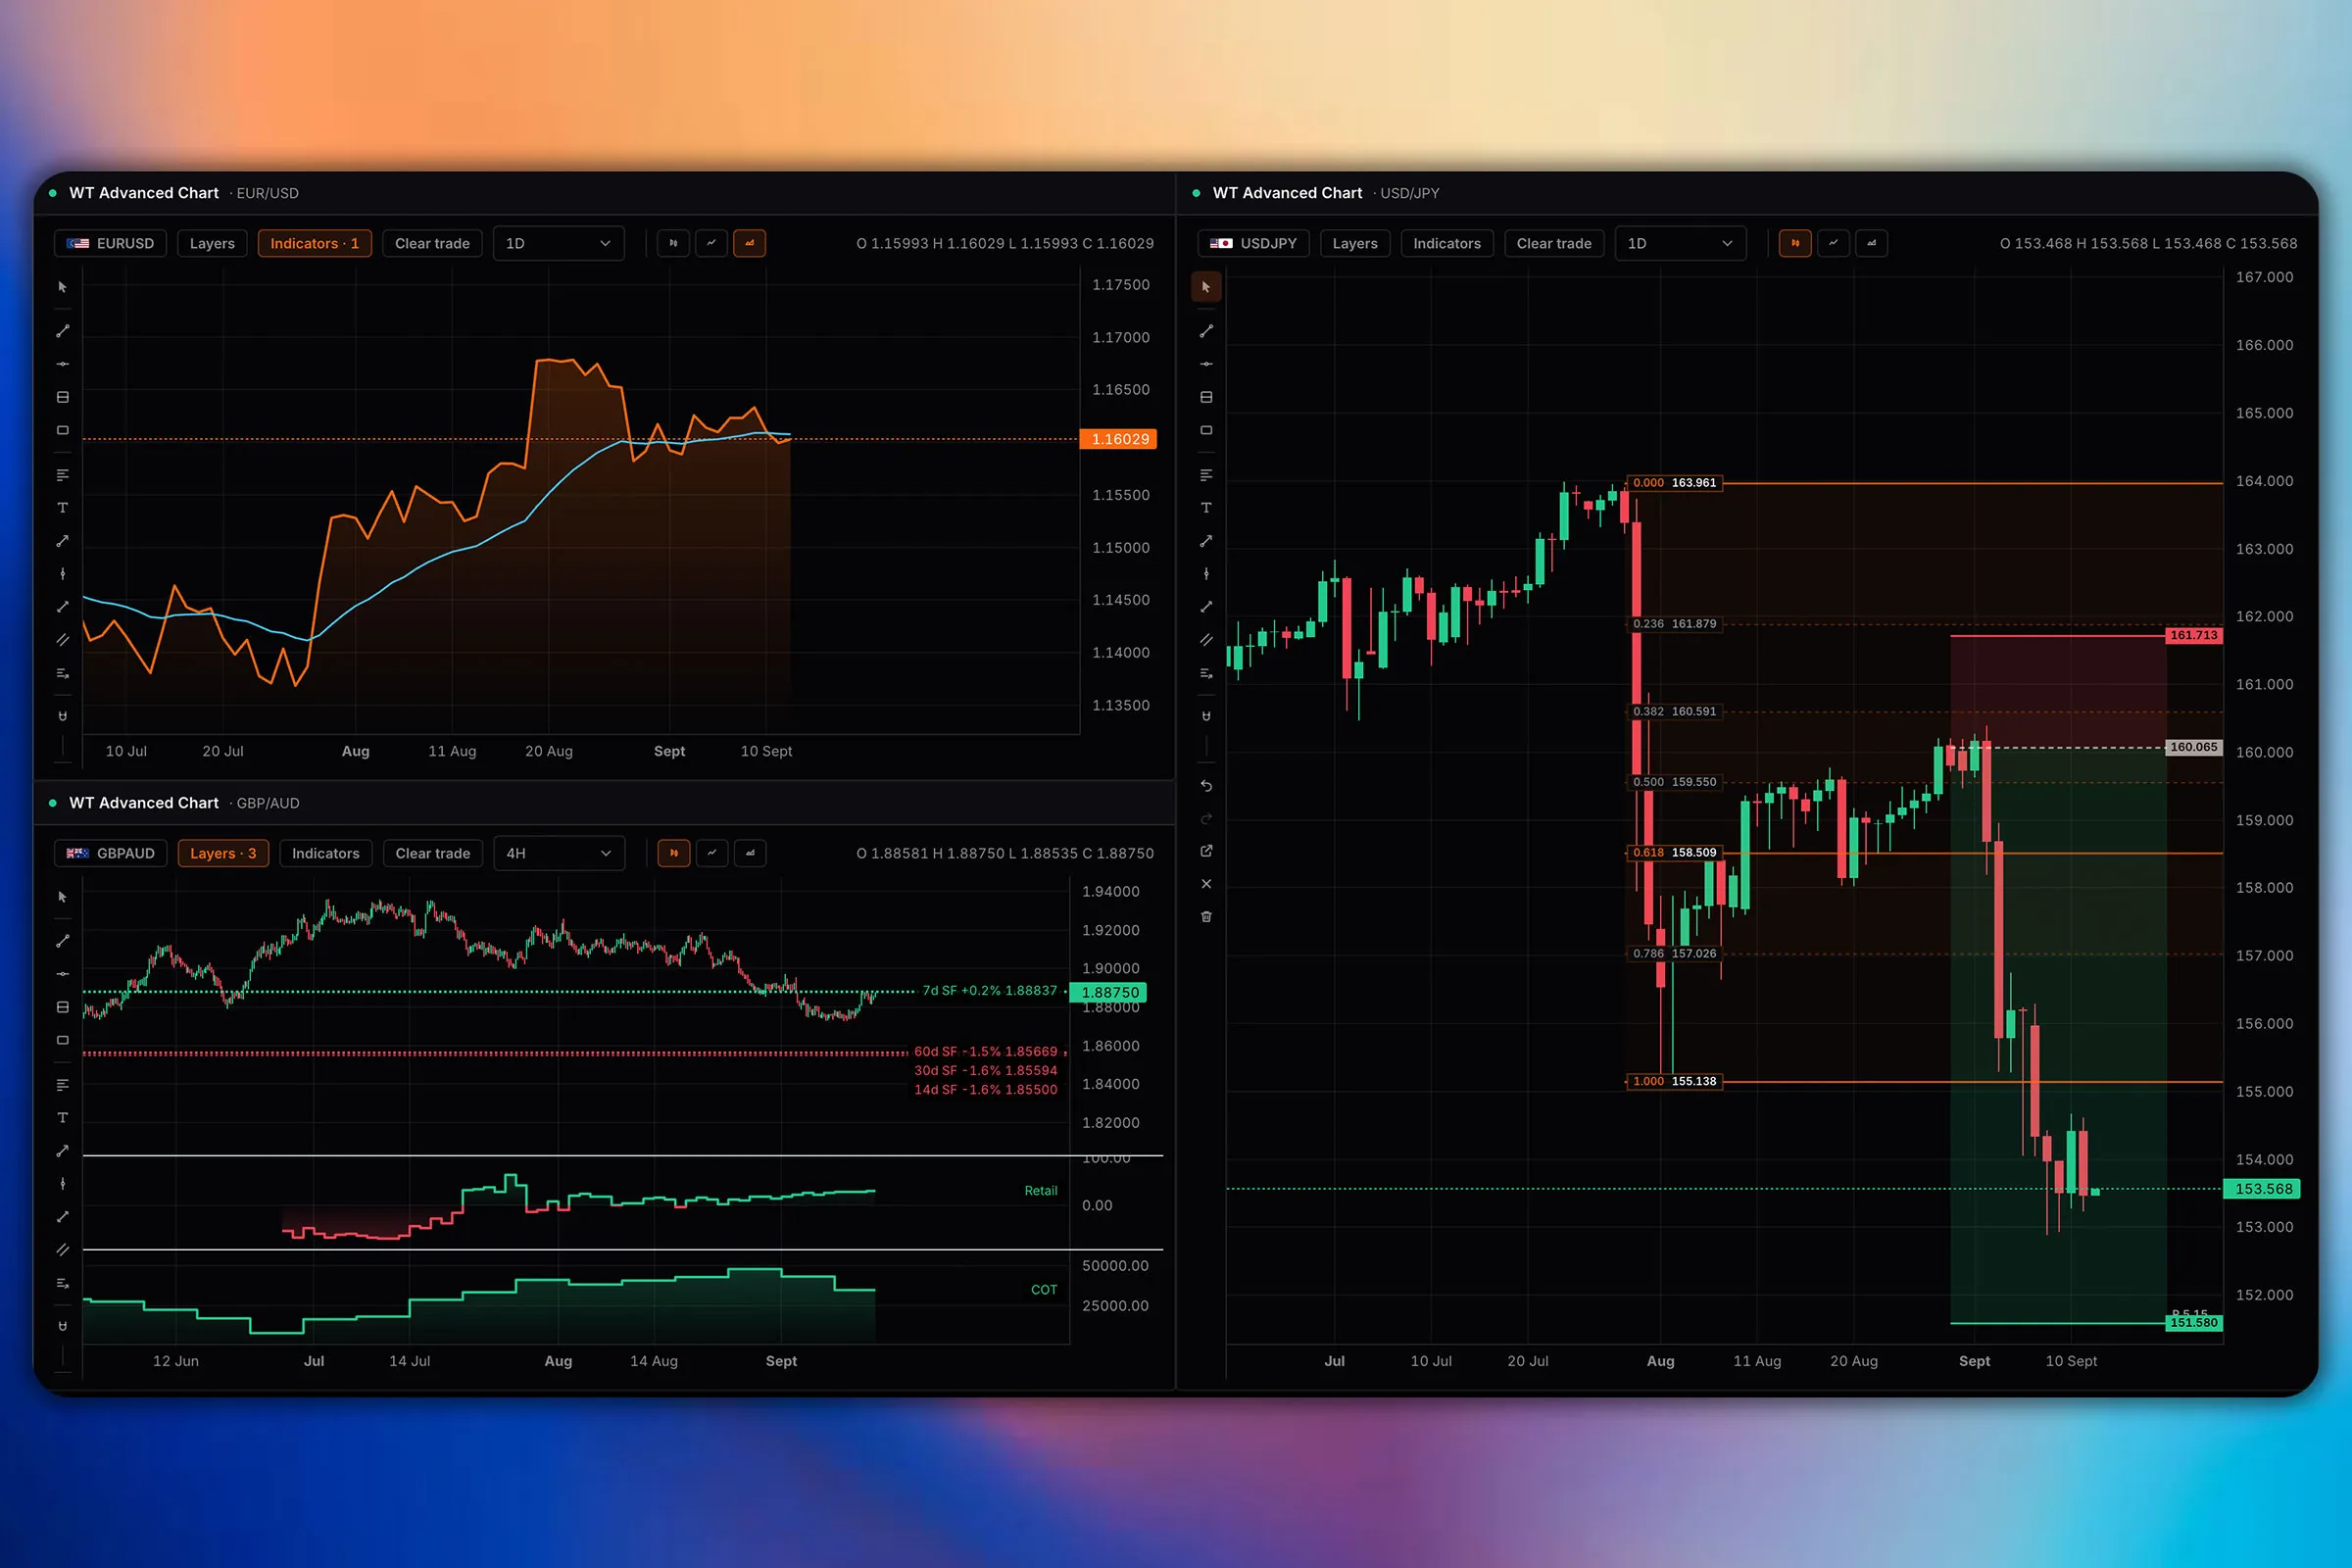
The terminal’s own data, drawn on the chart.
A full charting suite with the score, positioning and seasonal overlays laid over price, plus the statistics that frame a move: ATR, realised volatility over several windows, and returns across horizons.
The point is not another chart. It is being able to see the composite score and the positioning extreme on the same axis as the price that is supposed to reflect them.
The widget library
All 98 of them, by name.
55 are reachable on a free account, arranged across the 2 boards a free reader builds and keeps. The rest need Pro, because the widget is itself a Pro feature.
Scores and bias
10 widgets 8 free
-
Asset score history
FreeComposite score trajectory across the recorded history for the assets you select, with the net change over the chosen window. Shows where a bias has been drifting rather than where price has been.
-
Asset scores
FreeEvery monitored asset with its composite score and bias, from a quick scan down to a table that opens every driver behind each score side by side, with the seasonal window and the move since the last run.
-
Capital rotation map
FreeA Relative Rotation Graph: each asset plotted by relative strength across the horizontal and the momentum of that strength up the vertical, with a tail tracing its path through the Leading, Weakening, Lagging.
-
Conviction ranks
FreeCurrencies ranked by how far the composite sits from neutral, in either direction. A high reading means the engine holds a side with confidence; it says nothing about how far the market will travel.
-
Currency anatomy
ProDriver anatomy for one currency: the live scored drivers (rates, fundamentals, bank research, positioning, seasonality, risk flow) shown as tailwind/headwind spokes around the currency, plus a curated.
-
Currency snapshot card
FreeOne currency at a glance: its composite score and bias, the contribution of each driver behind it, central bank stance and COT positioning.
-
Driver matrix
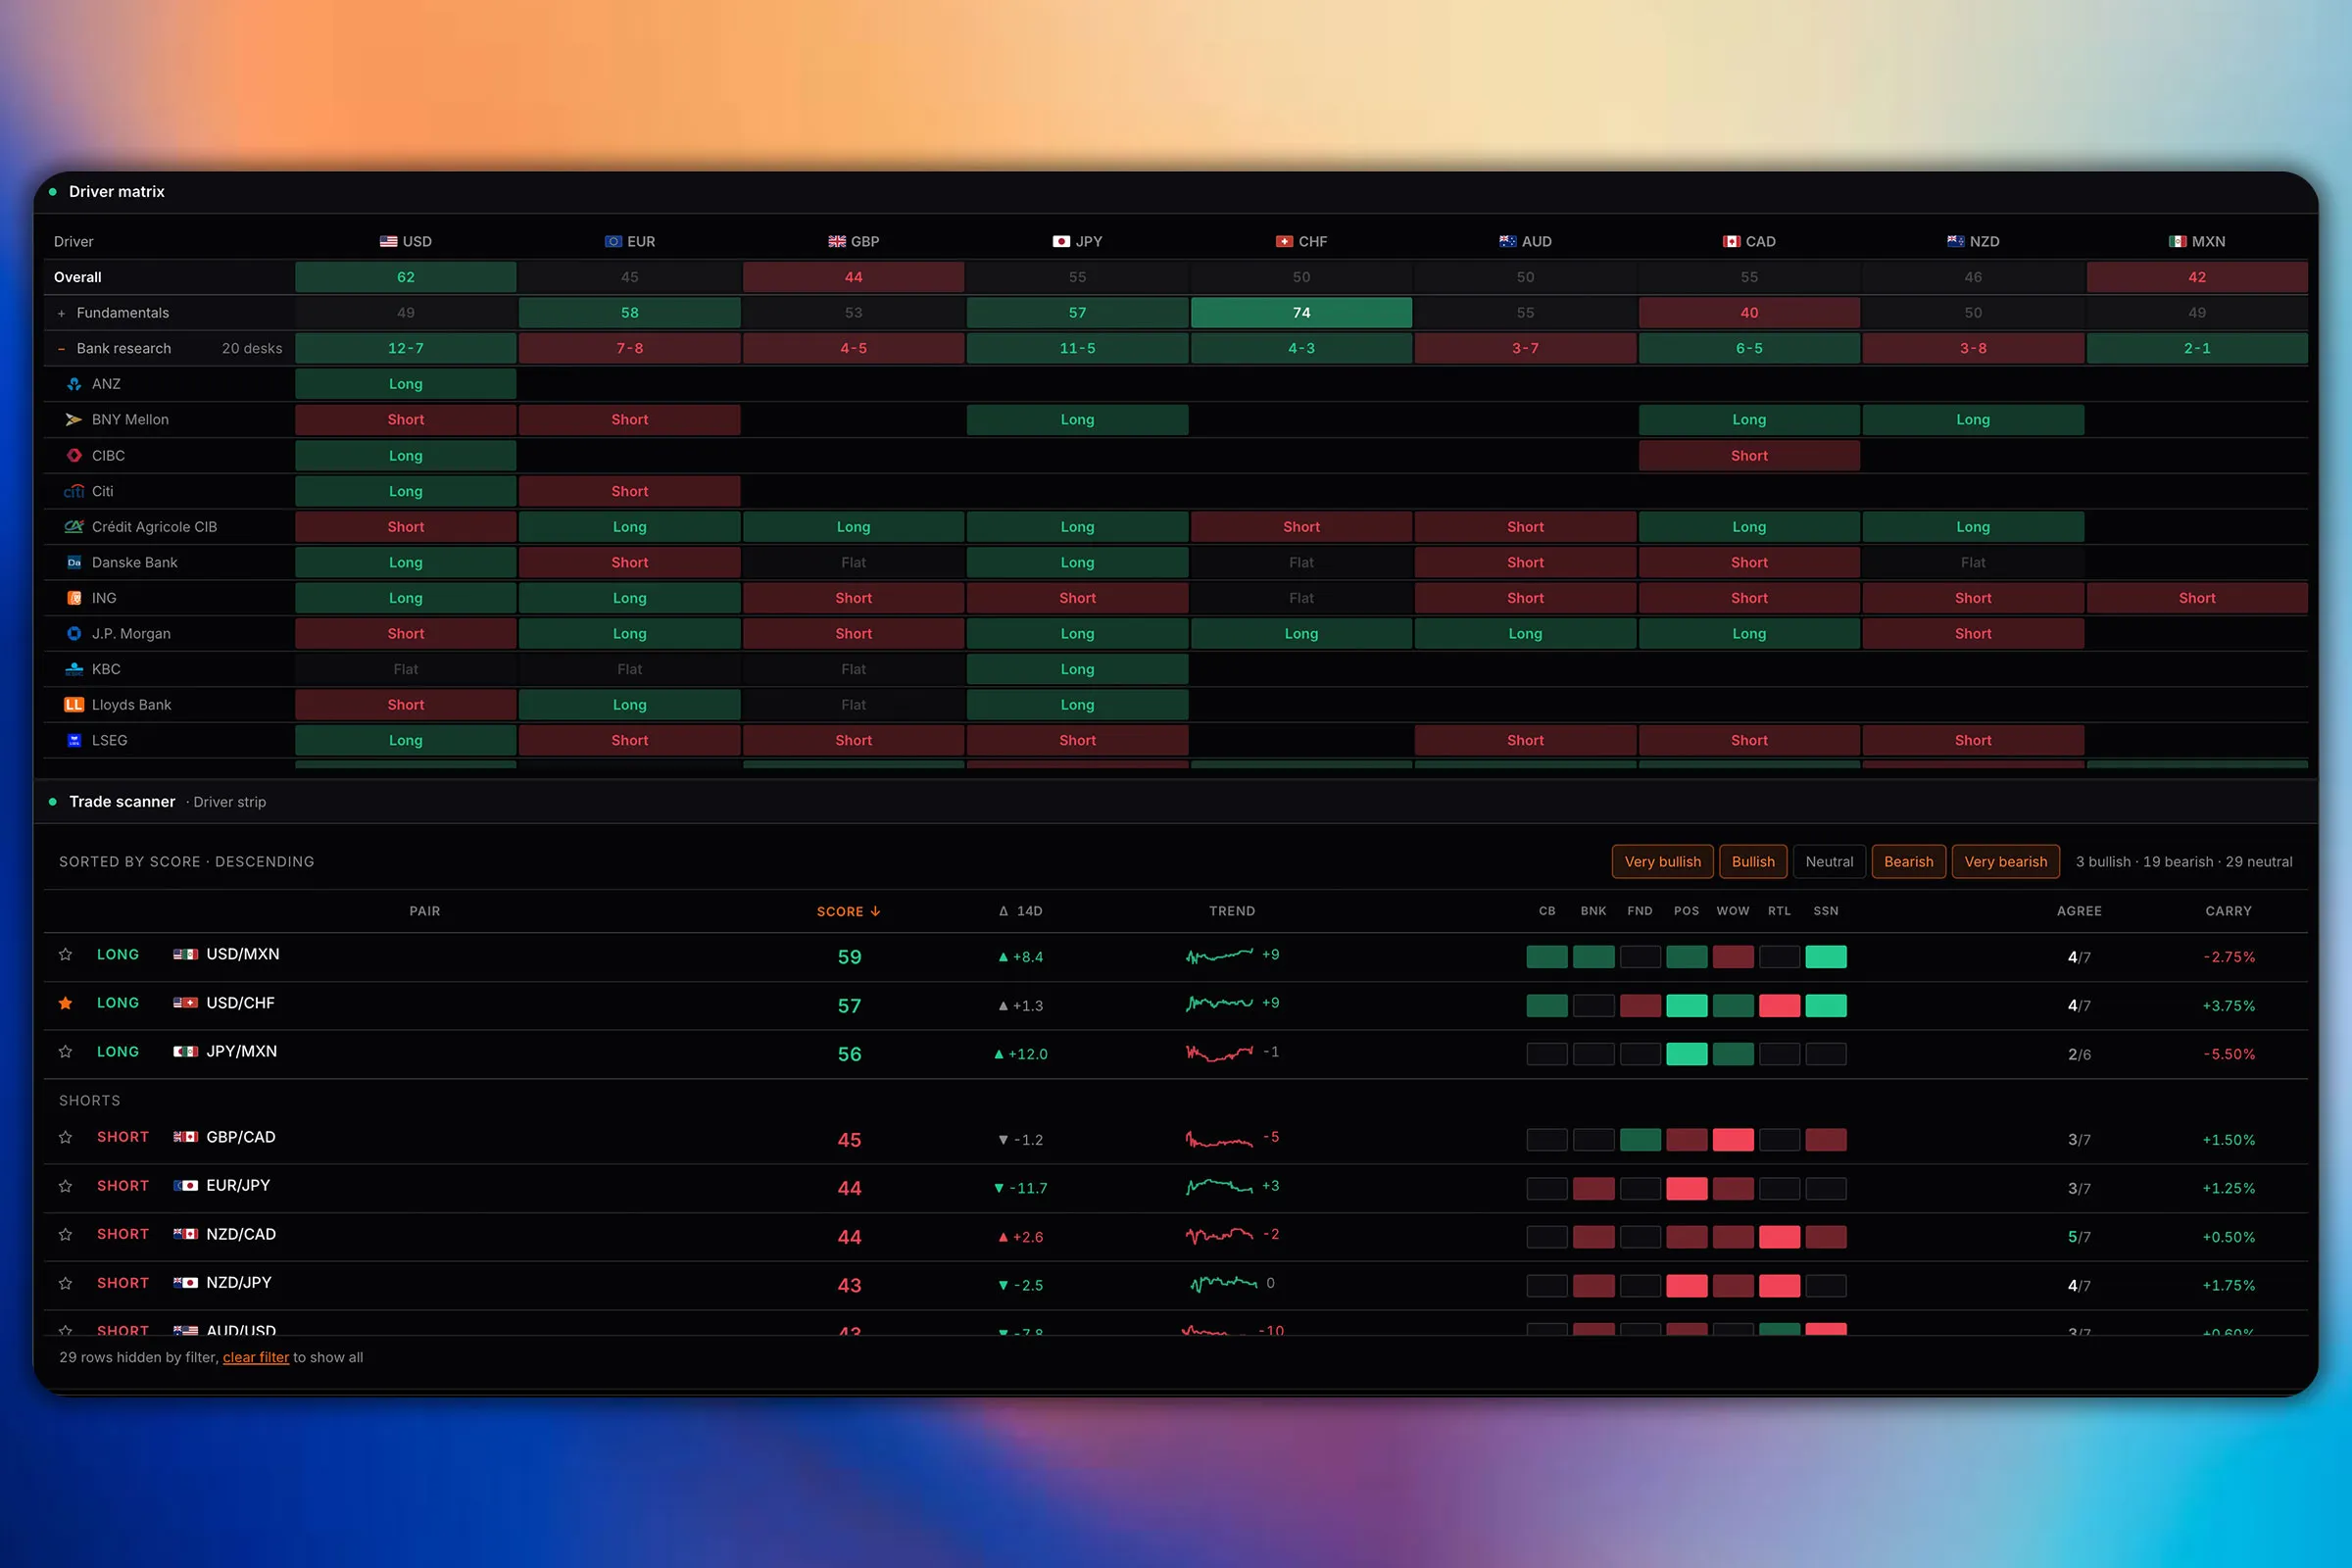
FreeEvery driver against every currency in one grid: fundamentals, bank research desk by desk, positioning, central bank and seasonality, with the composite pinned on top.
-
Research desk
FreeOne asset read end to end: what the composite is made of, what the research desk has written on it, and the central bank that sets its rate. Currencies, metals and indices; a cross is what Pair focus is for.
-
Score-shift log
FreeWhat has moved and by how much, in change-log form, ranked by the size of the shift and measured in scoring runs rather than days.
-
Weekly score movers
ProThe currencies whose composite score moved most over the past week, ranked by the size of that move. Score movement, not price movement: a currency can top this list on a week when its price barely moved.
Currency fundamentals
5 widgets 5 free
-
Asset releases
FreeEvery scored release for one asset in one table: what it printed, what was expected, what it was before, and the engine's read on each. A row opens to two years of history.
-
Fundamentals compare
FreeCompare the full macro fundamentals of currencies side by side: every tracked indicator (CPI, PPI, Services & Manufacturing PMI, GDP, unemployment, retail sales, trade balance and more) plus seasonality, the.
-
Macro fundamentals
FreeThe fundamentals score for each currency. Bar style breaks each currency into its per-category contributions; heatmap style puts one row per indicator, colour-coded across every currency.
-
Macro indicator history
FreeAny currency and indicator through time, as bars or a line. 24 months by default, with forecast dots overlaid on the actuals. Hover a point for the surprise against consensus.
-
Surprise index
FreeHow each currency's recent data has landed against consensus, weighted by the importance of each release and how recently it printed.
Positioning
13 widgets 10 free
-
COT correlation matrix
Pro26-week rolling correlation between COT positioning changes across currencies. Identifies which currencies are moving together (high positive correlation = doubling up on the same trade) and which are.
-
COT extremes
FreeCurrencies sitting at the extremes of their own COT percentile range, with net contracts, the weekly change and the reading behind each. Adjust the severity threshold to widen or narrow the filter.
-
COT positioning
FreeCommitment of Traders positioning across selected assets: where speculative positioning sits against its own history, the long and short split behind it, and how crowded each side has become.
-
COT positioning chart
FreeCommitment of Traders positioning over time. Chart one metric for a single asset, or compare several assets at the latest week or across their history. Weekly data, published Friday for the preceding Tuesday.
-
COT table
FreeWeekly Commitment of Traders data for one currency, week by week: positioning, the change on each week, and the weeks where net positioning flipped from one side to the other. Choose how far back to read.
-
COT week-on-week change
FreeThe change in net positioning against the prior week, ranked by the size of the shift. Shows where speculators added or cut most recently, which is a record of what they have already done rather than a signal.
-
Pair COT compare
ProBase vs quote COT positioning side by side: net position, 52w percentile, and long/short split for both legs of a pair.
-
Retail currency breakdown
ProFor one currency, shows where its aggregate retail lean comes from, broken down across every retail pair that touches it.
-
Retail extremes
FreeAssets where the retail crowd is most one-sided, ranked as contrarian fade candidates. Ranked list, centred bars or crowd-pressure meters.
-
Retail pair detail
FreeThe full retail crowd read for a single pair: the long and short split, the crowd's average entry price on each side, and how far price now sits from them. Full detail or split only.
-
Retail positioning
FreeRetail crowd long and short positioning across selected assets, as rows, donuts, ranked bars, columns, a heatmap or a table.
-
Retail positioning history
FreeDaily retail crowd positioning tracked over time. Plot the net lean (long% minus short%), crowd long%, or open interest, as a trajectory, a long and short split, the change over the window, or a table.
-
Retail vs smart money
FreeThe retail crowd set against speculators for each asset: one is read contrarian, the other as positioning by those who hedge and speculate at size. Agreement between them is a crowded trade on both sides;
Bank research
8 widgets 3 free
-
Bank consensus snapshot
FreeTop assets ranked by institutional consensus: bull%, bear%, coverage, and high-conviction calls.
-
Bank forecasts
ProInstitutional price projections for one asset: banks down the left with a column per quarter, the price chart on the right. Click a bank to plot its forecast path.
-
Bank trades
ProEvery open trade setup the banks have published: direction, entry, target and stop, with the reward ratio worked out. Click a row for the rationale, or plot any trade on its own chart.
-
Bank views
FreeWhat every desk is saying on one asset: its current call, its level, how strongly it holds it, and the thesis behind it.
-
Currency research
FreeWhat the bank research desks are publishing on one currency: the aggregate sentiment, the drivers behind it, the thesis, and the underlying reports.
-
Directional bank calls
ProEvery published view that takes a side, including those with no levels attached. Toggle bullish or bearish, read the thesis behind each one, and see which calls also carry a full setup.
-
Research feed
ProEvery bank report as it lands, with the desk’s logo, its conviction and the thesis behind the call.
-
Research inbox
ProEvery piece of research in one time-ordered stream: uploaded bank reports, the twice-daily briefs, the weekly report and research write-ups. Click any row to open it.
Central banks
7 widgets 6 free
-
CB detail
ProOne central bank in depth: policy rate, inflation, real rate, the stance the composite is using, and the next meeting.
-
CB rates & stance
FreePolicy rate, real rate, forward stance and next meeting date for the central banks you select, with the rate history and countdowns to each decision. For a ranking of stance alone, use Hawk,dove ranking.
-
CB repricing tracker
FreeWhich central banks the market has repriced most over a chosen lookback. Compares where the market prices each rate path today against where it priced it N days ago, ranked by the size of the shift, and can.
-
Carry ranking
FreeThe rate-differential carry for every currency pair, long the higher-yielder and short the lower, ranked.
-
Hawk–dove ranking
FreeThe central banks you select ranked from most hawkish to most dovish, using the same stance reading the composite scores from. The gap between two banks is the policy divergence behind their currency pair.
-
Next CB meetings
FreeUpcoming policy decisions for the central banks you select, ordered by how soon they land. Scheduled meetings only, so an unscheduled decision does not appear here until it is announced.
-
Rate expectations
FreeWhat the market expects each central bank to do at its next meeting: cut, hold or hike, with the conviction behind it and the implied rate after the move.
Rates and yields
2 widgets 0 free
-
Treasury yield history
ProOne maturity through time, as a yield or as the move in basis points across the window. Windows run from one month to the full published series, which begins in 1962 for the ten year.
-
US yield curve
ProThe US Treasury curve: its current shape, the key spreads (2s10s, 3m10s, 5s30s) and their recent history, real yields against CPI year on year, and whether any part of the curve is inverted.
Calendar and news
5 widgets 3 free
-
Economic calendar
FreeMacro releases with actual, forecast and previous values, across windows from the next 24 hours out to the next 30 days, or looking back at what has already printed.
-
Event countdown
FreeLive countdown to the next high-impact economic events for tracked currencies: each shown with the affected currency’s current score/bias and consensus vs prior, so you see at a glance what a beat or miss.
-
Recent releases
FreeChronological list of economic releases in the last 24h that have an actual value. Colour-coded above / below / in line with forecast.
-
Trending headlines
ProStories drawing outsized news coverage right now, ranked by how far coverage runs above its normal level. Shows what the market is collectively watching;
-
WT Wire
ProThe corroborated WT Wire. Fast-newswire headlines cross-checked across sources: CONFIRMED (2+ wires agree), OFFICIAL (primary source), or DEVELOPING (single source, not yet corroborated).
Research and narrative
7 widgets 1 free
-
Analyst videos
ProThe daily video desk: the hook, the written summary and the takeaways pulled from each transcript. Opening one plays it inside the panel rather than taking over the board.
-
Currency takes
ProA one-line read on every monitored currency, written by the engine at the latest scoring run. Each take reflects the score at that run, so it ages with the scoring cycle rather than with price.
-
Currency themes
ProThe macro themes and geopolitical risks tagged to one currency at the latest scoring run. These describe what the research and news flow are built around;
-
Daily need-to-know
FreeThe short daily read: the lead macro headline, the paragraph behind it, and the numbered watch items.
-
Daily report
ProThe newest macro daily brief in full: choose the EU session (generated ~07:00 UTC) or the US session (~11:00 UTC). Auto-updates as fresh reports are generated. Click any element to open in the full reader.
-
Weekly brief
ProThe engine's own editorial for the week: the theme it is built around, the narrative written on it, and the numbered need-to-know watch items.
-
Weekly report
ProThe newest weekly report as a pinned card: what it led with, the section of your choice underneath, and the six pair ideas the engine captured when it was written, each with the reasoning published alongside.
Trade ideas
6 widgets 1 free
-
Momentum basket
ProThe whole board ranked by how far it has moved over a week, a month, a quarter and a year, with the acceleration between the recent pace and the long-run one.
-
Pair scanner
ProAll pairs meeting a minimum score divergence threshold: live, auto-ranked by edge strength.
-
Top 5 pairs
ProThe five pairs with the largest directional edge. Same ranking as Top conviction pair, which shows the leader alone.
-
Top conviction pair
ProThe single pair with the largest directional edge. Full card, compact single row, or expanded breakdown bars. Same ranking as Top 5 pairs, which shows the leading five.
-
Top divergences
ProThe cleanest two-sided divergence trades on the board. Ranks pairs by the score gap multiplied by the conviction of the weaker leg, so a 60-bull against a 30-bear outranks an 80-bull against a 50-neutral at.
-
Trade scanner
FreeEvery tradable read the engine holds in one ranked table: the crosses and every metal, commodity and index scored on its own.
Crosses
5 widgets 2 free
-
Currency compare
ProTwo currencies set against each other: composite scores, the drivers behind them, central bank stance and COT positioning.
-
Currency pair heatmap
FreeThe full pair score matrix across the major currencies, with the strongest edges called out.
-
Pair calendar
ProThe economic calendar filtered to one pair, covering both the base and quote currencies. Shows forecast and previous ahead of each release, and the actual once it prints.
-
Pair focus
FreeThe full breakdown for one pair: the composite score, both currencies' components set side by side, central bank stance, COT positioning and the written read on each leg. Opens to the full deep-dive.
-
Pair score history
ProComposite pair score over time for the pairs you select. Derived from the two per-currency score histories, folded the same way every pair score is: 50 plus half the gap between base and quote.
Market data
12 widgets 5 free
-
Asset statistics
FreeStatistical profile for any asset: historical volatility, return percentiles, price position against the 52-week and 5-year range, moving-average deviation, drawdown, and a 30-day return distribution.
-
Currency strength index
FreeRelative currency strength over time, indexed to 100 at the start of the window. Pick the currencies to compare and the timeframe.
-
Index constituents
ProWhat is inside an index and what each name is worth to it: weights, concentration, and where today’s move came from.
-
Live currency strength
ProWhich currencies are being bought and sold right now, built from live ticks. Each currency is scored by the average move across every streaming pair it appears in, so it is a read on the whole board rather.
-
Live movers
ProBiggest gainers and losers across your selected assets, ranked and re-sorted live as prices tick, with green/red flashes.
-
Live prices
ProReal-time prices across FX majors, metals, commodities (WTI, copper) and equity indices. Choose which asset groups to show and whether to display the day change. Values stream live and flash on each tick.
-
Market tape
ProA scrolling ticker of live prices across FX, metals, commodities and indices, with direction arrows and a flash on each move.
-
Price correlation matrix
ProRolling correlation of daily price returns across instruments. High positive = moving together (stacked risk); negative = natural hedges. Computed live from price history.
-
Seasonal price forecast
FreeThe seasonal path ahead for any asset, projected forward over your chosen horizon from the average of what it did on these calendar days in previous years, rebased so today reads zero.
-
Seasonality
FreeHistorical seasonal % path for any asset: currency, commodity, equity index, or major pair (pair paths are base − quote). Line chart (5/10/15y), monthly bars, or a forward-move table across all assets.
-
Volatility ranking
ProRealised volatility and average daily range across selected assets, ranked: FX pairs, metals, WTI and equity indices.
-
WT Advanced Chart
FreeWatchTower native chart. 44 assets: FX, metals, commodities, indices. Candles, area or line, across 5m to 1M timeframes.
Portfolio
10 widgets 7 free
-
Conviction check
FreeYour trade direction versus the score-implied direction, position by position. Green where you are trading with the composite score, red where you are fighting your own signal.
-
Event radar
FreeUpcoming high-impact economic events for the currencies in your book, ranked by proximity, each mapped to the positions it touches: so you know what is about to move your portfolio and where.
-
My portfolio
FreeYour book in one panel: live price and change, the composite score, which leg the engine favours, and the full written read on each pair. Add and remove positions here, and set each one long or short.
-
Portfolio briefing
ProAn AI risk read on your whole book: what it is betting on, whether it aligns with the composite scores, how concentrated it is, and the single key upcoming catalyst.
-
Portfolio changes
FreeWhat has moved under the positions you hold, and whether it moved your way. Composite score and day price change for each one, signed to the side you are trading it.
-
Portfolio concentration
ProHow much of your notional sits on a single bet. Distils your net currency exposure into one concentration reading plus an effective number of independent bets, with a stacked bar of where the risk sits.
-
Portfolio correlation
FreeWhether your positions move as one. Correlates the daily returns of your holdings over a real window, then signs each pairing by the side you are trading it, so a positive reading always means two positions.
-
Portfolio exposure
FreeNet currency exposure across your positions: which currencies you are effectively long and which you are short, once the pairs are broken into their two legs.
-
Portfolio prices
ProYour portfolio assets with live prices and change%, flashing on every tick. Auto-updates as you add or remove from your portfolio.
-
You vs the crowd
FreeHow your positions sit against retail sentiment and COT smart money, currency by currency. Fading a crowded retail book (alongside the specs) is the contrarian sweet spot;
Risk and sentiment
4 widgets 1 free
-
Geopolitical monitor
ProActive geopolitical situations on a rotating globe, a flat map, or as a list. Clicking a situation opens it in place rather than navigating away from the board.
-
Market regime
FreeWhere the market sits right now, read purely from price action: risk assets against havens, the dollar strengthening, weakening or ranging, and volatility calm, normal or stressed against its own baseline.
-
Risk regime
ProThe risk-on and risk-off model: the composite gauge, the signals feeding it, and how much each one contributes. Model-driven, so it can disagree with price.
-
Risk-asset prices
ProLive prices for the assets used as risk proxies, with the 24-hour change and recent path for each. These are the inputs behind the risk regime reading, shown raw so you can see what is driving it.
Squawk
1 widgets 1 free
-
Squawk chat
FreeLive channel discussion from Squawk: post, reply and react without leaving the board. New messages arrive over a live connection rather than on a refresh timer. Use “Open chat” for the pop-out.
Utility
3 widgets 2 free
-
Data freshness
ProHow recently each underlying data feed was refreshed, colour-coded by staleness. Tells you whether a quiet widget is quiet because the market is quiet or because its source has stopped updating.
-
FX market status
FreeWhether the FX market is open right now, with the time remaining until the next open or close. The week runs from roughly 21:00 Sunday to 21:00 Friday UTC.
-
Session clock
FreeLive clocks for the four FX sessions, Sydney, Tokyo, London and New York, with whether each is open or closed and how long until that changes.
The usual ones.
How many widgets does WatchTower have?
98 placeable widgets across 15 categories, all named on this page. 55 are reachable on a free account, arranged across the 2 boards a free reader builds and keeps. The rest need Pro, because the widget is itself a Pro feature.
What markets are covered?
9 currencies: USD, EUR, GBP, JPY, CHF, AUD, CAD, NZD and MXN. 6 metals and energy markets: gold, silver, platinum, palladium, copper and WTI. 9 equity indices: S&P 500, Nasdaq 100, Dow, DAX, FTSE, CAC, Euro Stoxx, IBEX and Nikkei. Positioning runs across 44 markets.
Whose research is aggregated?
A roster of 48 institutions, including ING, MUFG, UniCredit, Westpac, Danske Bank, Crédit Agricole CIB, SEB, Scotiabank and others. Each report is read and reduced to its thesis, direction, conviction, price target and horizon, then compared against every other desk covering the same market.
Can I build my own layout?
Both tiers build their own. A free account gets 2 boards, drawn from the 55 widgets the plan carries. Pro gives you the full 98, an empty grid and as many workspaces as you need.
Does it give trade signals?
No. It describes data and shows the macro read with the reasoning behind it. It never gives an entry, a stop or a position size. Those decisions stay yours.
In short
WatchTower Terminal is built from 98 widgets across 15 categories, arranged into boards. The categories are Scores and bias, Currency fundamentals, Positioning, Bank research, Central banks, Rates and yields, Calendar and news, Research and narrative, Trade ideas, Crosses, Market data, Portfolio, Risk and sentiment, Squawk, Utility. A free account reaches 55 of those widgets through 2 boards they build themselves; Pro at $49 a month opens all 98 and lifts the board limit. Coverage is 9 currencies, 6 metals and energy markets and 9 equity indices, with positioning across 44 markets and 8 central banks tracked.