All 98 widgets across 15
categories, with 405 settings documented: where each number comes
from, how often it moves, what each control does, and the way it is commonly misread.
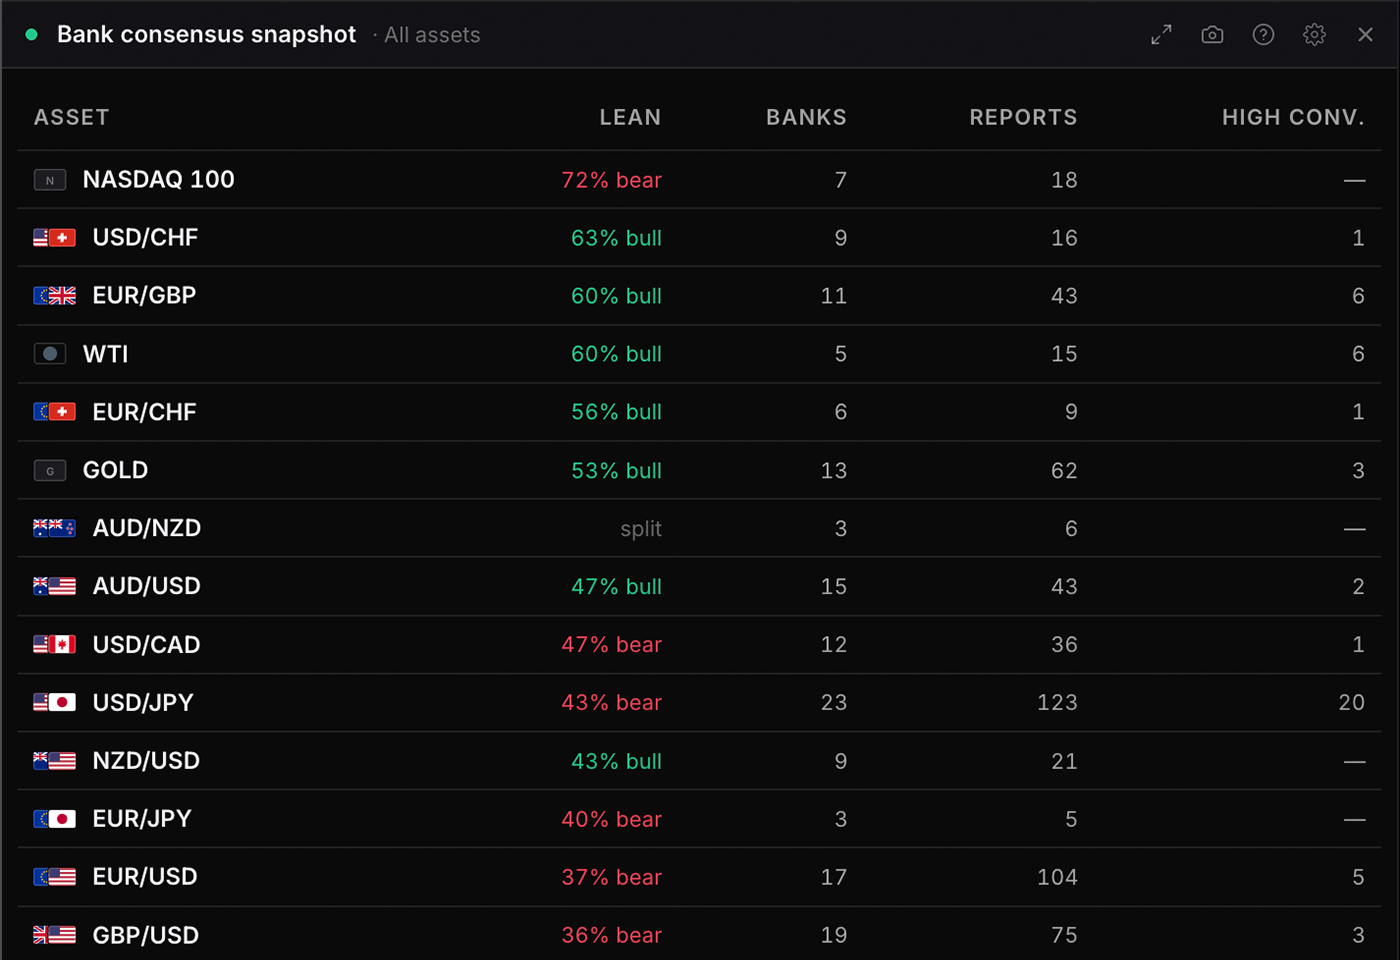
Top assets ranked by institutional consensus: bull%, bear%, coverage, and high-conviction calls.
Settings
Asset
Every asset by default. On an asset drilldown it narrows to that market by itself, unless you choose otherwise here. Crosses the price feed does not carry are never listed, since a row that cannot open a chart is not worth filtering to.
Choices are built from whatever the data currently
covers, so the list changes with the markets on the board.
Minimum coverage
Coverage counts reports. The bank column shows how many separate desks those reports came from.
1 report or more
2 reports or more
3 reports or moredefault
5 reports or more
Visualisation
Tabledefault
Bull and bear split
Coverage against conviction
Research inbox
bank_reports_inbox
Free
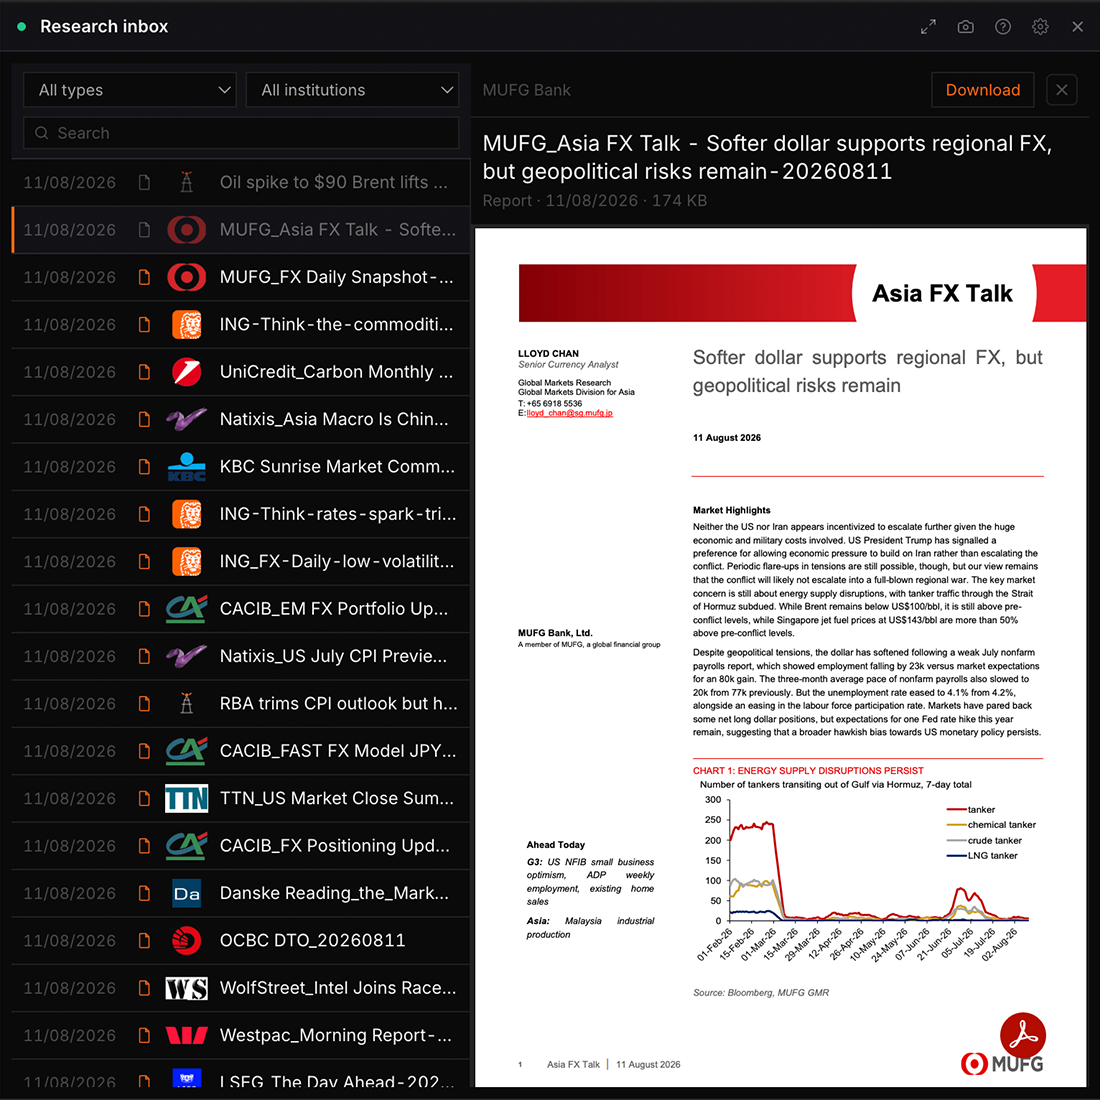
Every piece of research in one time-ordered stream: uploaded bank reports, the twice-daily briefs, the weekly report and research write-ups. Click any row to open it. Sources are gated separately, so anything your plan does not cover is named rather than quietly missing.
Settings
Sources
Each source is gated separately, so one being unavailable does not affect the others.
Bank reports
Daily briefs
Weekly report
Research
Window
An item with no date survives every window rather than disappearing into one.
Last 7 days
Last 30 daysdefault
Last 90 days
Everything held
Items shown
The window decides how far back to look; this decides how much of it to draw. The footer says when this is what cut the list.
25
50
100default
250
Everything in the window
Bank trades
bank_trades
Pro
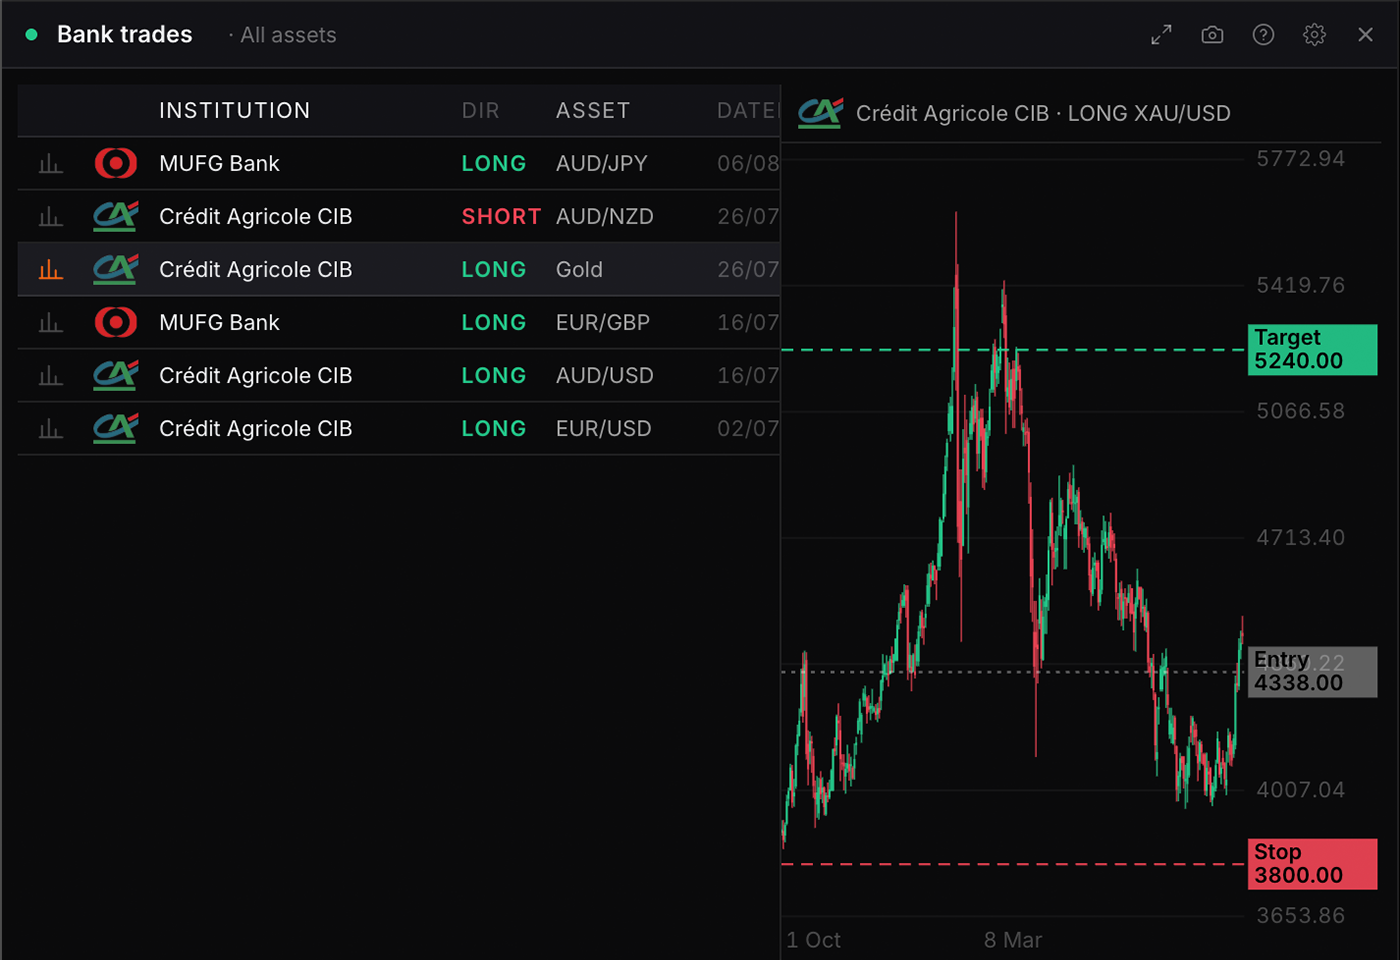
Every open trade setup the banks have published: direction, entry, target and stop, with the reward ratio worked out. Click a row for the rationale, or plot any trade on its own chart.
Settings
Asset
Only assets the price feed covers are listed, so every trade has a chart to sit on. Every one of them shows by default.
All assetsdefault
Direction
Bothdefault
Longs only
Shorts only
Sort by
Newest firstdefault
Best reward ratio
By asset
History shown
6 months
1 yeardefault
2 years
Bank forecasts
bank_forecasts
Pro
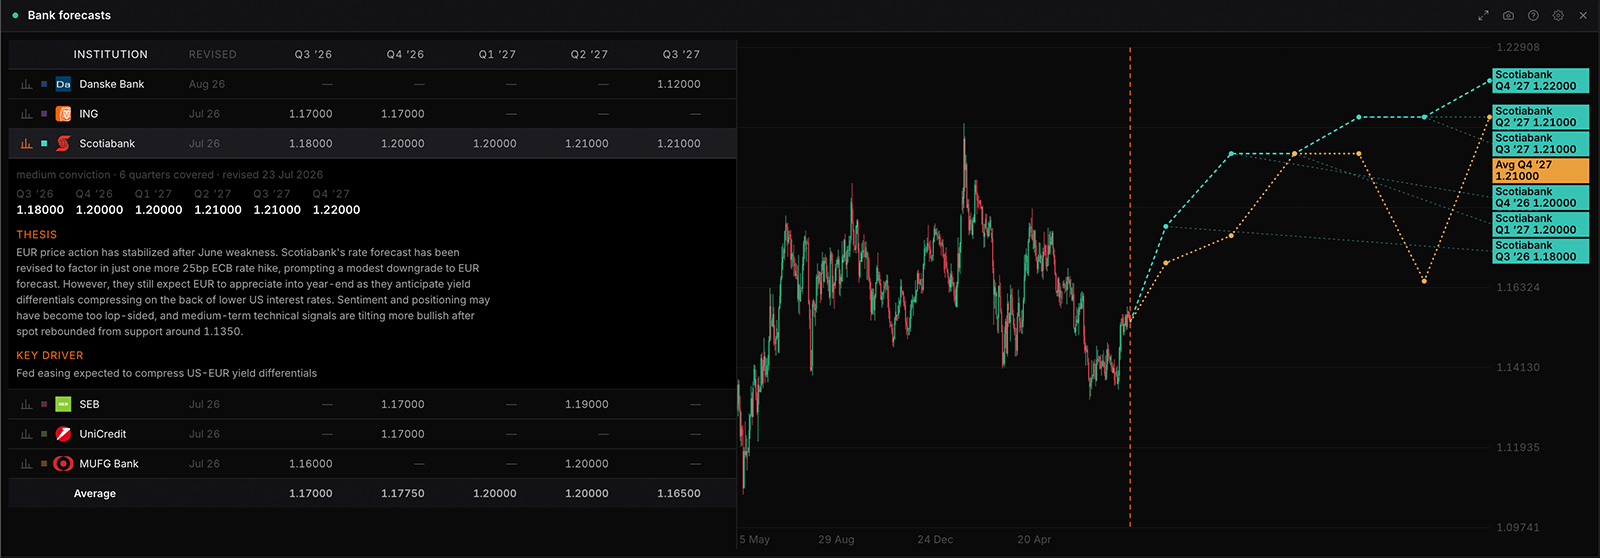
Institutional price projections for one asset: banks down the left with a column per quarter, the price chart on the right. Click a bank to plot its forecast path. Quarters run forward from the current one, so the grid moves on by itself.
Settings
Asset
Only assets the price feed covers are listed, so every forecast has a chart to sit on. All assets lists every desk and market together; clicking one draws it, and the chart follows the market that row belongs to.
All assets
Quarters shown
Columns run forward from the current quarter, so a quarter drops off once it has passed.
Four
Sixdefault
Eight
History shown
Matched keeps the candles roughly the same span as the forecast ahead of them.
Matched to horizondefault
6 months
1 year
2 years
5 years
Reference lines
Compared within a quarter, not across the grid. Highest and lowest are drawn only where at least two banks cover the same quarter; the Average row shows the count behind every cell.
Average
Highest
Lowest
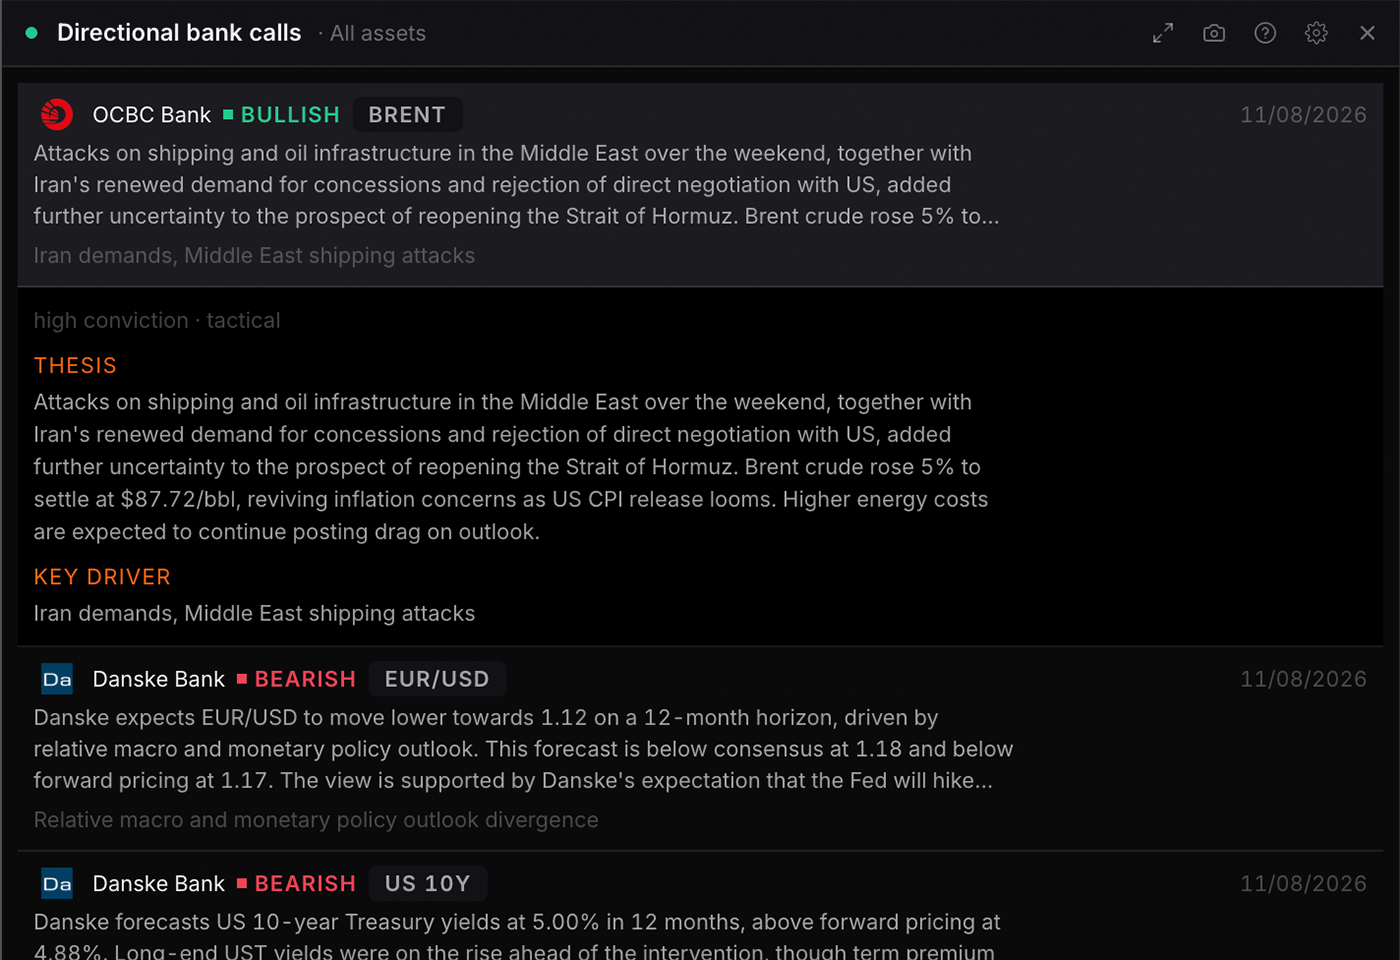
Directional bank calls
feed_bullish
Free
Every published view that takes a side, including those with no levels attached. Toggle bullish or bearish, read the thesis behind each one, and see which calls also carry a full setup. Cards, compact list, or grouped by asset.
Settings
Asset
Every asset by default. On an asset drilldown it narrows to that market by itself, unless you choose otherwise here. Assets the price feed does not carry are never listed.
Choices are built from whatever the data currently
covers, so the list changes with the markets on the board.
Direction
Bullish callsdefault
Bearish calls
Both sides
Visualisation
Cardsdefault
Compact list
Grouped by asset
Window
The research feed keeps about sixty days, so there is no longer window to offer.
Last 7 days
Last 30 daysdefault
Everything held (60 days)
Conviction
Anydefault
High only
Calls shown
12
24default
48
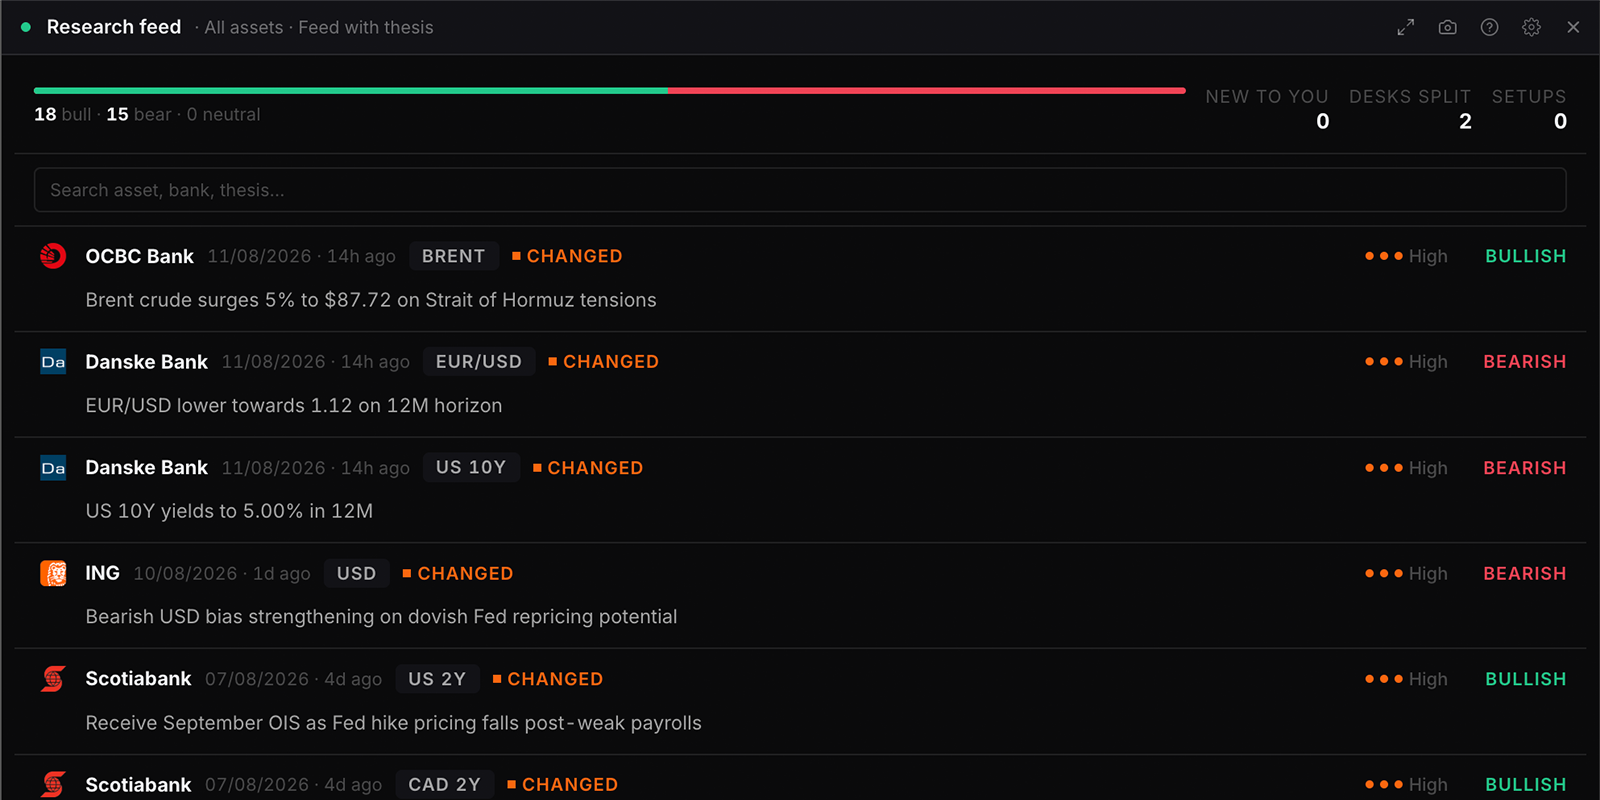
Research feed
research_feed
Free
Every bank report as it lands, with the desk’s logo, its conviction and the thesis behind the call. Search it, filter by bank, currency, theme or conviction, and open any row for the key driver, the full thesis and how the view differs from that desk’s last one. Quick filters for what is new to you, who has changed their mind, where two desks disagree on the same asset, which calls carry a full setup, and the assets in your own book.
Settings
Asset
Every asset by default. On an asset drilldown it narrows to that market by itself, unless you choose otherwise here. Unlike Currencies, this matches the exact instrument rather than either of its legs.
Choices are built from whatever the data currently
covers, so the list changes with the markets on the board.
Visualisation
Feed with thesisdefault
Grouped by asset
Grouped by bank
Compact titles
Window
A report with no readable date is always shown rather than dropped by a window it cannot be tested against.
Last 7 days
Last 14 daysdefault
Last 30 days
Last 60 days
All available
Show
Changed views are reports where the bank said how this differs from its own previous call. Disagreement is two desks on opposite sides of the same asset inside the window you are looking at.
Everythingdefault
New since I last looked
Changed views only
Where desks disagree
Full trade setups only
Assets in my book
Sentiment
Bullish
Bearish
Neutral
Conviction
High
Medium
Low
Currencies
Reports with no tagged asset always show, since an absent tag is not evidence of irrelevance.
Choices are built from whatever the data currently
covers, so the list changes with the markets on the board.
Banks
Empty means every desk.
Choices are built from whatever the data currently
covers, so the list changes with the markets on the board.
Themes
The themes the extraction tagged on each report. Empty means every theme, and an untagged report is never hidden by this.
CB divergence
Growth
Geopolitical
Positioning
Technical
Valuation
Consensus strip
Showdefault
Hide
Search bar
Showdefault
Hide
Show
20 newest
50 newestdefault
100 newest
250 newest
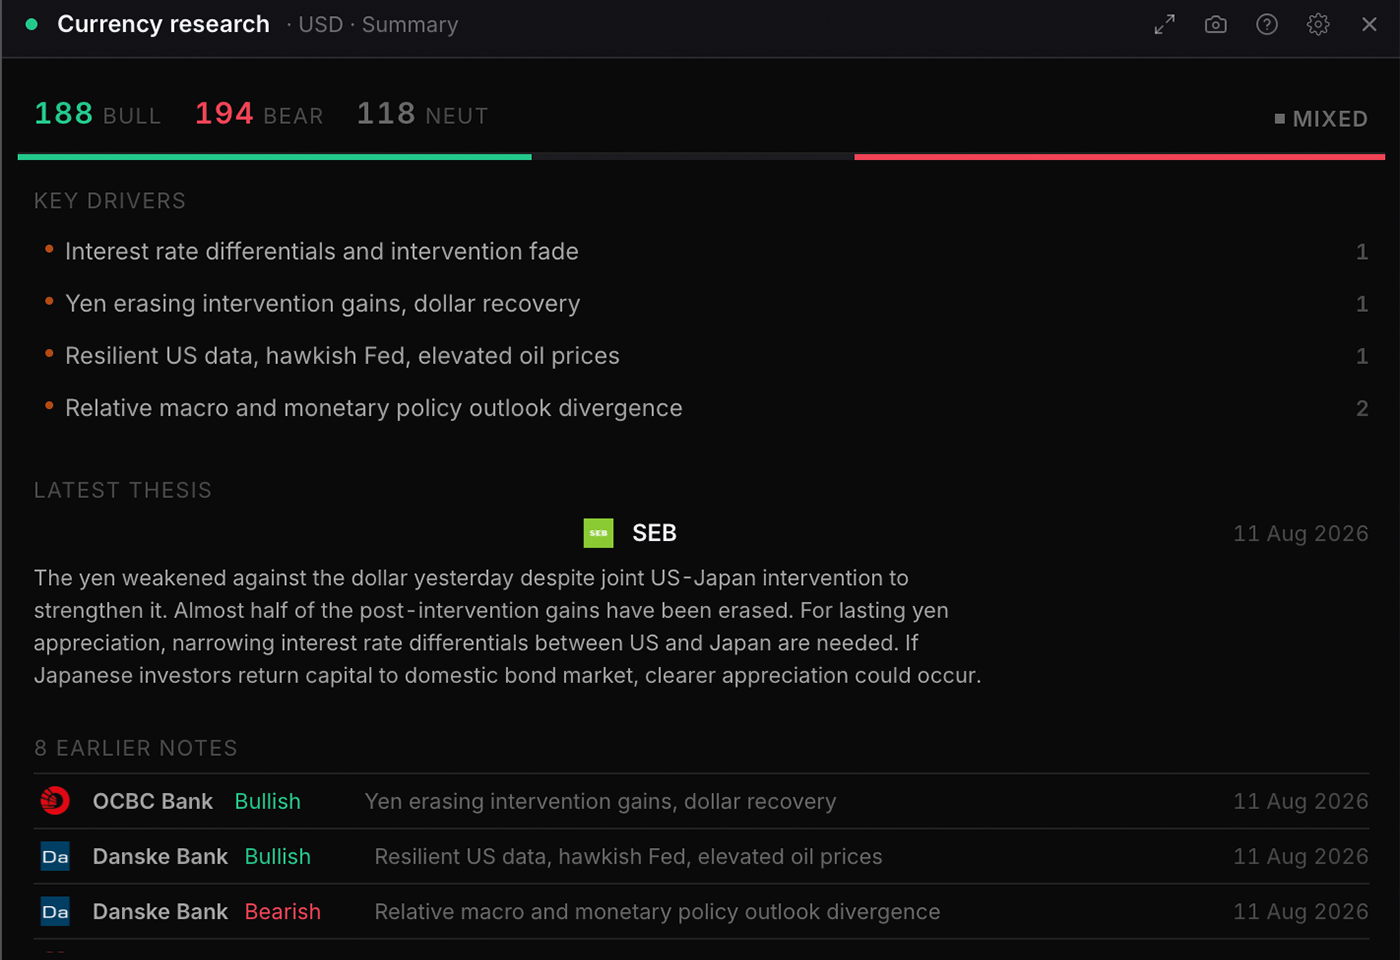
Currency research
currency_research
Free
What the bank research desks are publishing on one currency: the aggregate sentiment, the drivers behind it, the thesis, and the underlying reports. Sentiment counts published views, so a quiet week can move it as much as a change of mind.
Settings
Currency
Choices are built from whatever the data currently
covers, so the list changes with the markets on the board.
Window
Bank calls age. The default reads the last 30 days; All time counts every report ever ingested, which is an archive rather than a current view. Reports carrying no upload time are always included rather than silently dropped by a date filter.
Last 30 daysdefault
Last 7 days
Last 90 days
All time
Visualisation
Summarydefault
Report list
Drivers
Sentiment
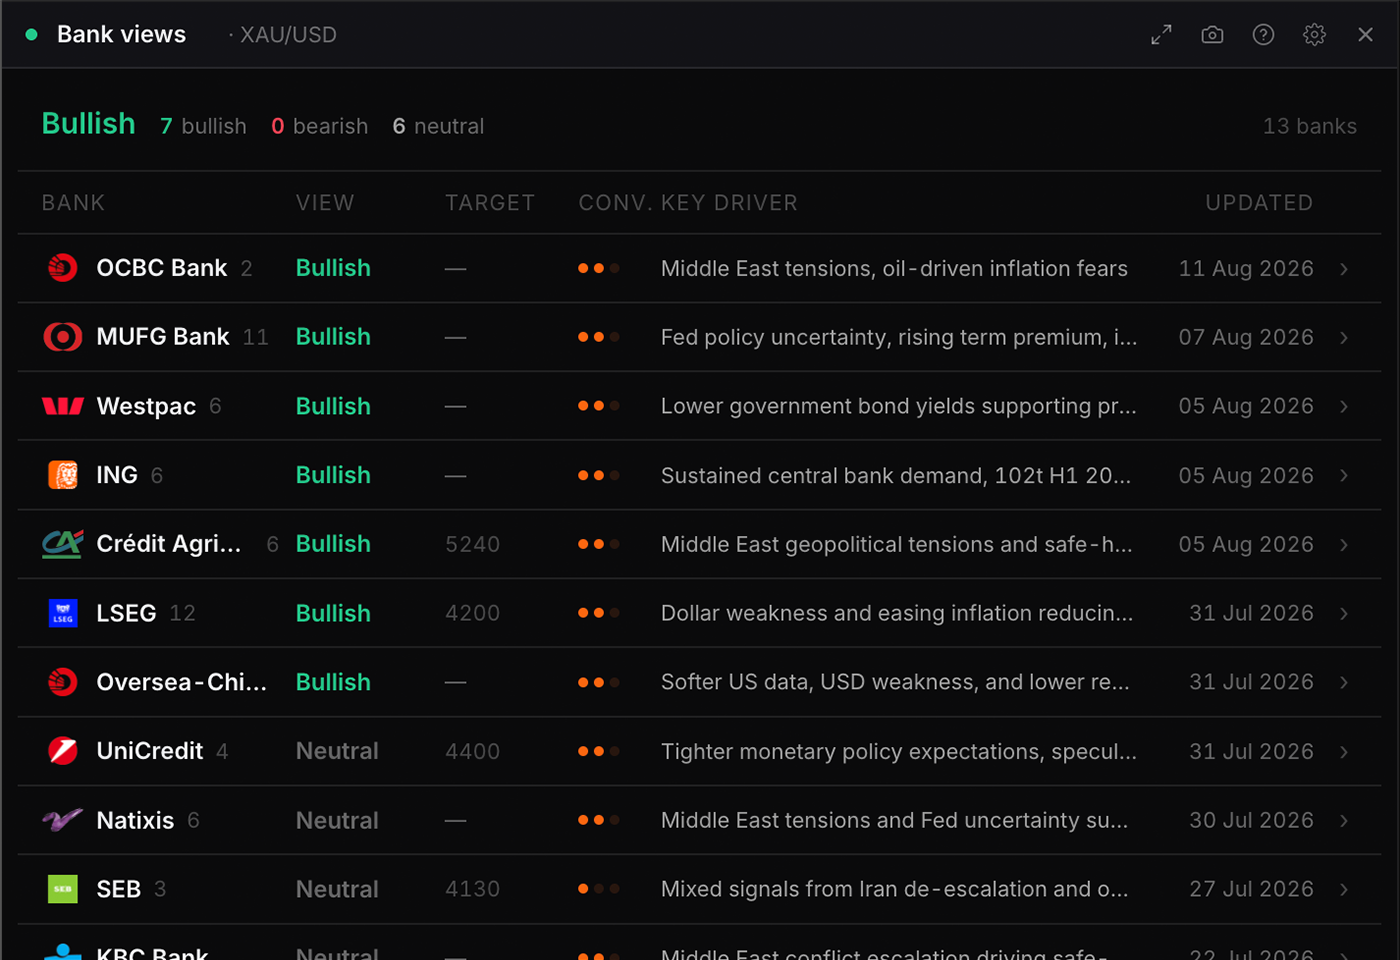
Bank views
bank_views
Free
What every desk is saying on one asset: its current call, its level, how strongly it holds it, and the thesis behind it. One row per bank rather than per report, with everything that bank said before it kept underneath.
Settings
Asset
Only assets this platform covers, most published on first. A desk\u2019s note on DXY is counted under USD, on SILVER under XAG, and so on.
All assets
Show
Every bankdefault
Bullish only
Bearish only
High conviction only
Key driver
The one line the desk led with. Hiding it leaves the call, the level and the date.
Showdefault
Hide
Calendar & news
5 widgets
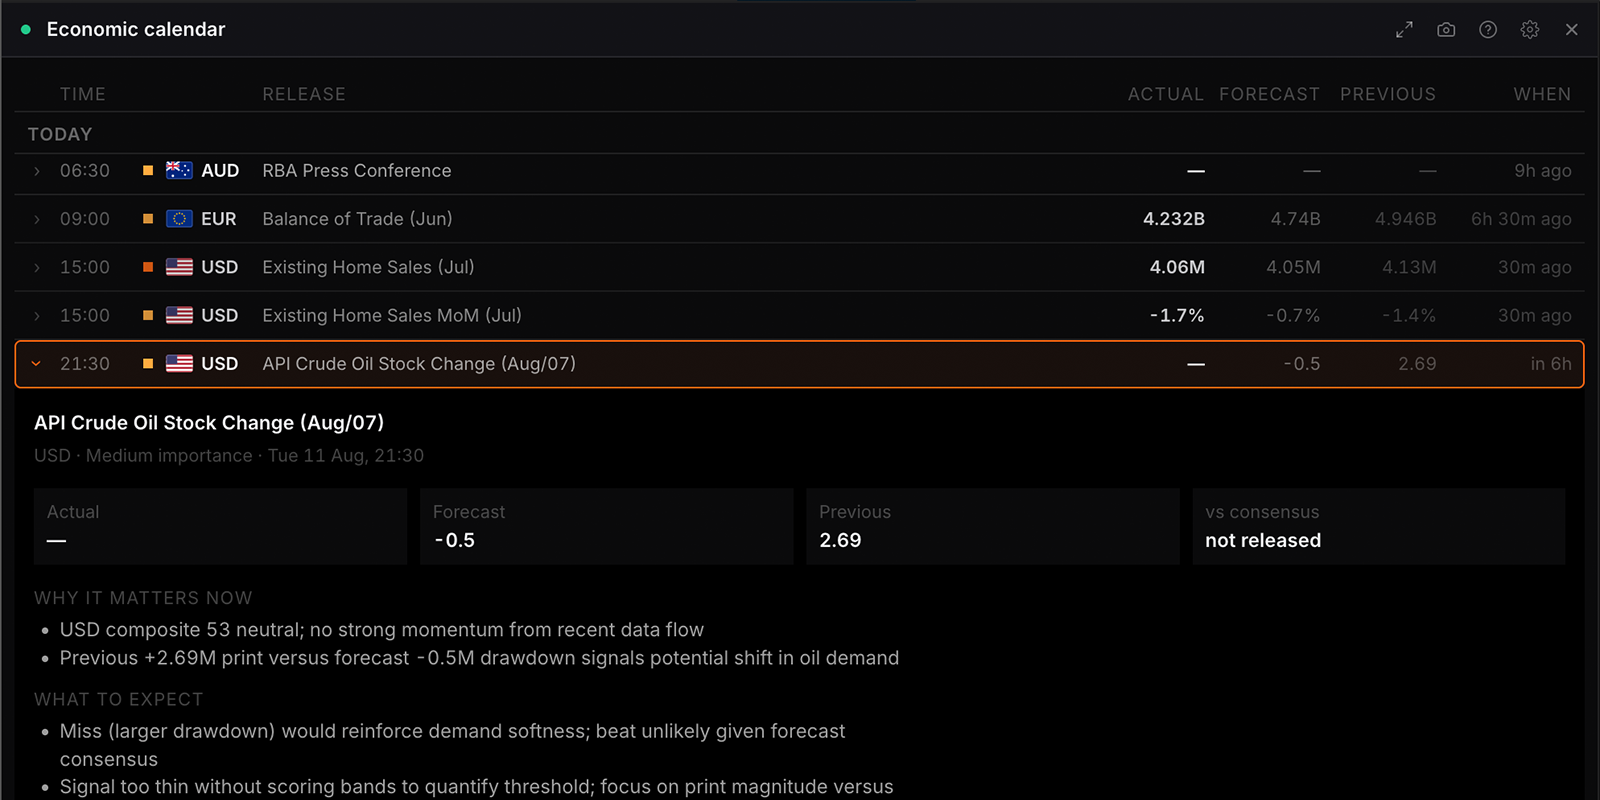
Economic calendar
econ_calendar
Free
Macro releases with actual, forecast and previous values, across windows from the next 24 hours out to the next 30 days, or looking back at what has already printed. Filter by impact level and currency, and read it as an agenda, a week grid, or grouped by which currency carries the event risk.
Settings
Currencies
Only the currencies this platform covers are listed.
Choices are built from whatever the data currently
covers, so the list changes with the markets on the board.
Impact
High only
Medium and highdefault
Everything
Window
The feed holds 30 days forward, so 30 days is the furthest view available.
Today
Next 24 hours
This week (Mon\u2013Sun)default
Next 7 days
This month
Next 30 days (full horizon)
Released, last 7 days
Visualisation
Agendadefault
Week grid
Event risk by currency
Table
Countdown
Time until release, in the last column.
Showdefault
Hide
Flags
Showdefault
Hide
Density
Comfortabledefault
Compact
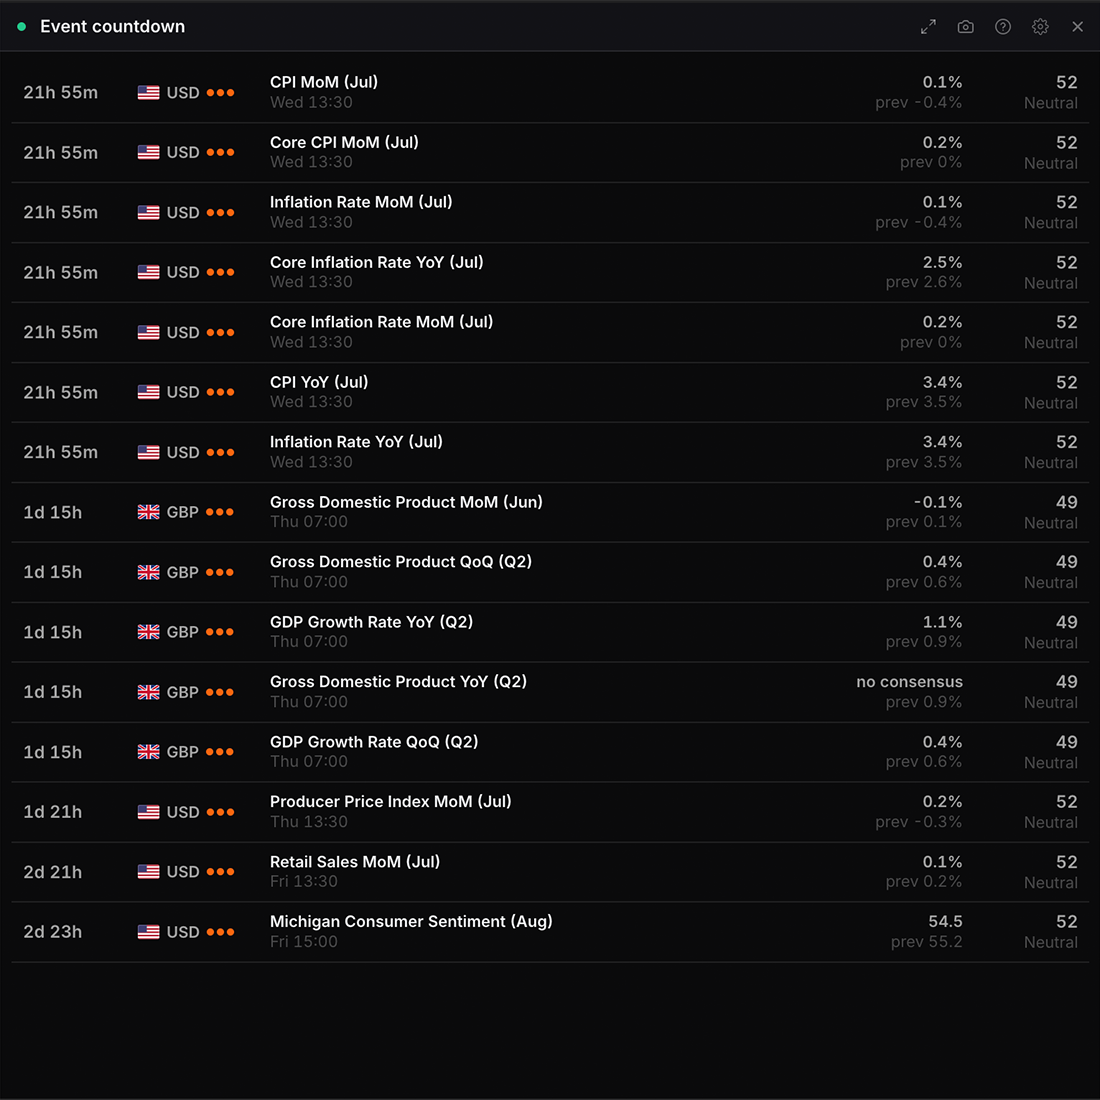
Event countdown
econ_countdown
Free
Live countdown to the next high-impact economic events for tracked currencies: each shown with the affected currency’s current score/bias and consensus vs prior, so you see at a glance what a beat or miss would move.
Settings
Currencies
Each event carries the current score and bias of the currency it lands on, so a surprise reads against a live position.
Choices are built from whatever the data currently
covers, so the list changes with the markets on the board.
Events shown
Just the next one
Next 3
Next 5default
Next 10
All in window
Window
12 hours
24 hoursdefault
3 days
1 week
Impact
High onlydefault
Medium and high
All
Visualisation
Each event carries the current score and bias of the currency it lands on, so a surprise reads against a live position.
Countdown rowsdefault
Table
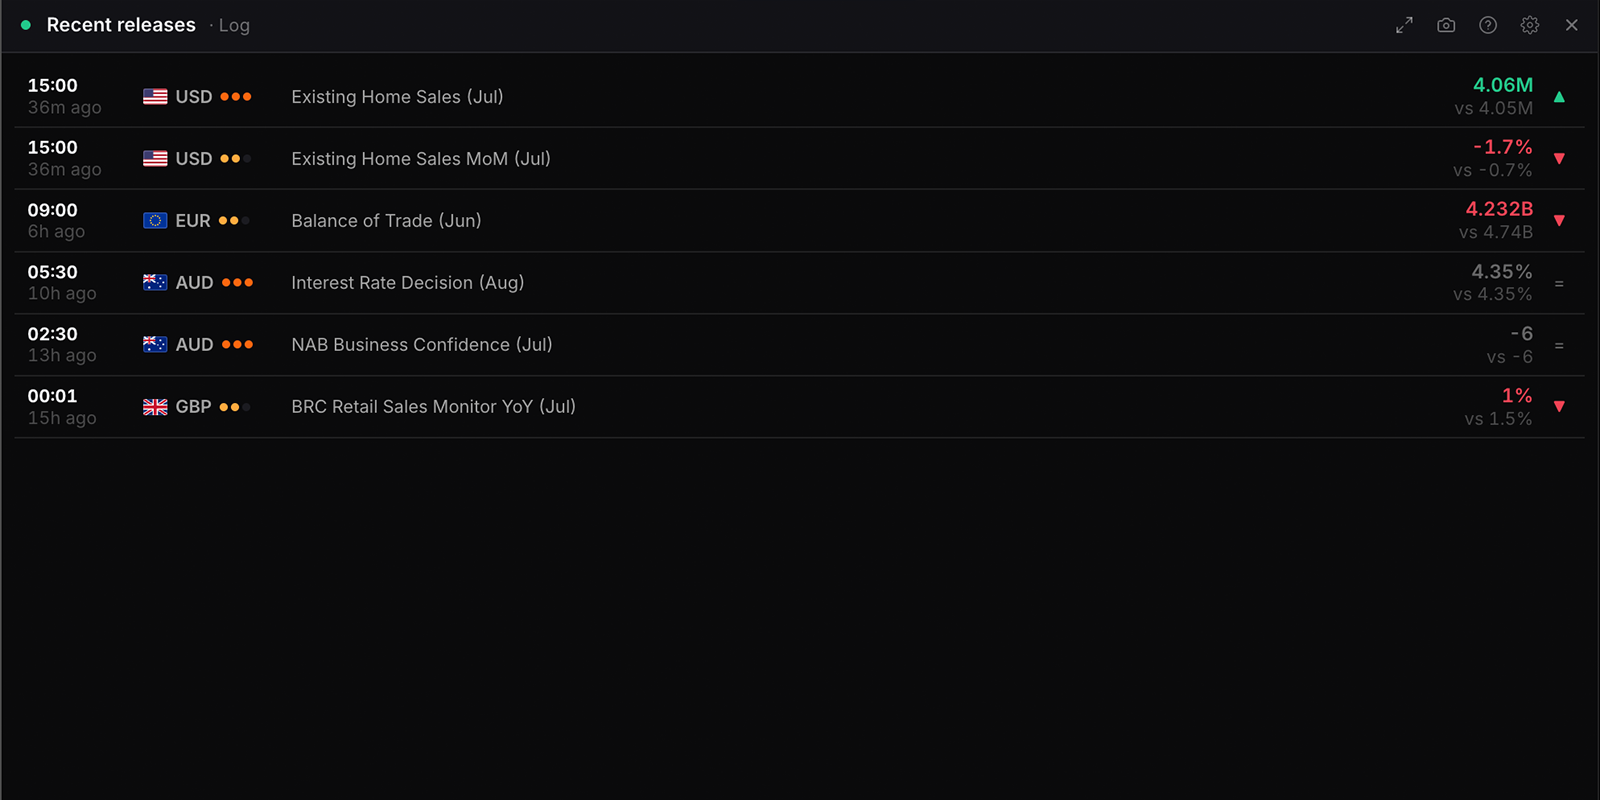
Recent releases
recently_released
Free
Chronological list of economic releases in the last 24h that have an actual value. Colour-coded above / below / in line with forecast.
Settings
Currencies
Above or below forecast describes the number only. A higher reading is not automatically good; on unemployment or claims it is the opposite.
Choices are built from whatever the data currently
covers, so the list changes with the markets on the board.
Window
Last 6 hours
Last 12 hours
Last 24 hoursdefault
Last 48 hours
Impact
Alldefault
Medium and high
High only
Sort by
Newest firstdefault
Highest impact first
Visualisation
Above or below forecast describes the number only. A higher reading is not automatically good; on unemployment or claims it is the opposite.
Logdefault
Table
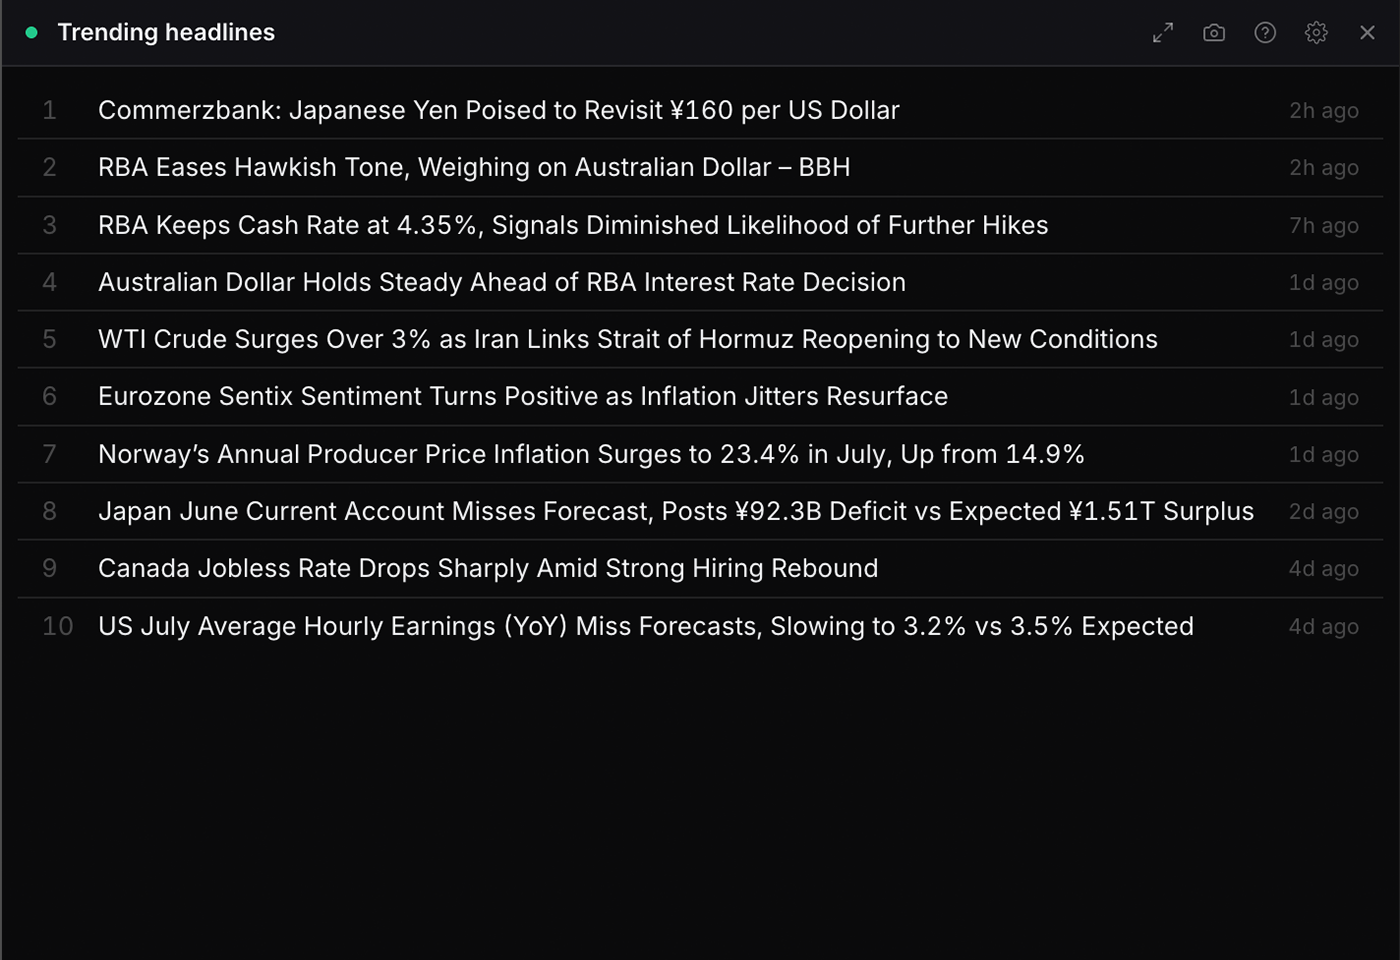
Trending headlines
live_trending
Pro
Stories drawing outsized news coverage right now, ranked by how far coverage runs above its normal level. Shows what the market is collectively watching; heavy coverage marks where attention sits, not which way price goes.
Settings
Visualisation
Listdefault
Compact
With sentiment
Show
Top 5
Top 10default
Top 15
Everything held
WT Wire
live_news_feed
Pro
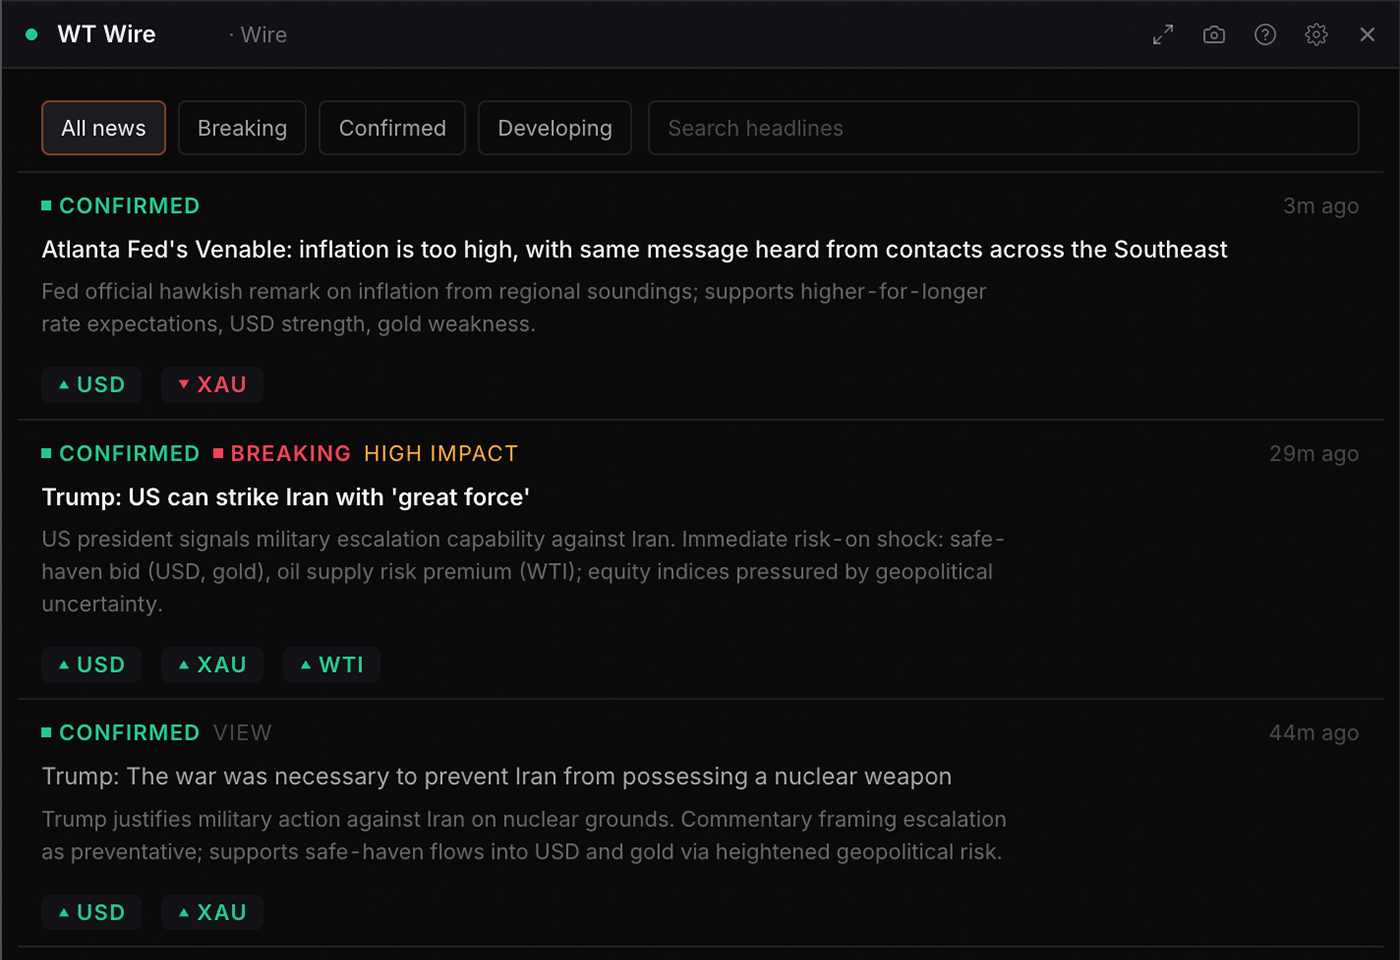
The corroborated WT Wire. Fast-newswire headlines cross-checked across sources: CONFIRMED (2+ wires agree), OFFICIAL (primary source), or DEVELOPING (single source, not yet corroborated).
Settings
Assets
Assets are inferred from the feed\u2019s tags and the headline text.
Choices are built from whatever the data currently
covers, so the list changes with the markets on the board.
Trust levels
Official is a primary source. Confirmed is two or more wires agreeing. Developing is a single wire, not yet cross-checked.
Official
Confirmed
Developing
Impact
Graded by the classifier on the tracked markets, separately from how well corroborated the story is. Not market relevant is off by default.
Choices are built from whatever the data currently
covers, so the list changes with the markets on the board.
Commentary
Commentary is a third-party view or forecast about markets. An event is something that happened.
Events and commentarydefault
Events only
Commentary only
Order
Sorting by impact puts the movers at the top of a busy hour; sorting by time is the wire as it landed.
Newest firstdefault
Impact, then newest
Window
Last hour
Last 6 hours
Last 24 hoursdefault
Last 7 days
Everything held
Breaking
All headlinesdefault
Breaking only
Filter tabs
All news, Breaking, Confirmed and Developing. Multi-select, so Breaking plus Confirmed is one press each.
Showdefault
Hide
Search bar
Searches the headline and summary of everything held in the current window.
Showdefault
Hide
Visualisation
Wiredefault
Corroboration split
Flow by asset
Table
Summaries
Showdefault
Hide
Density
Comfortabledefault
Compact
Central banks
7 widgets
CB detail
cb_detail
Free
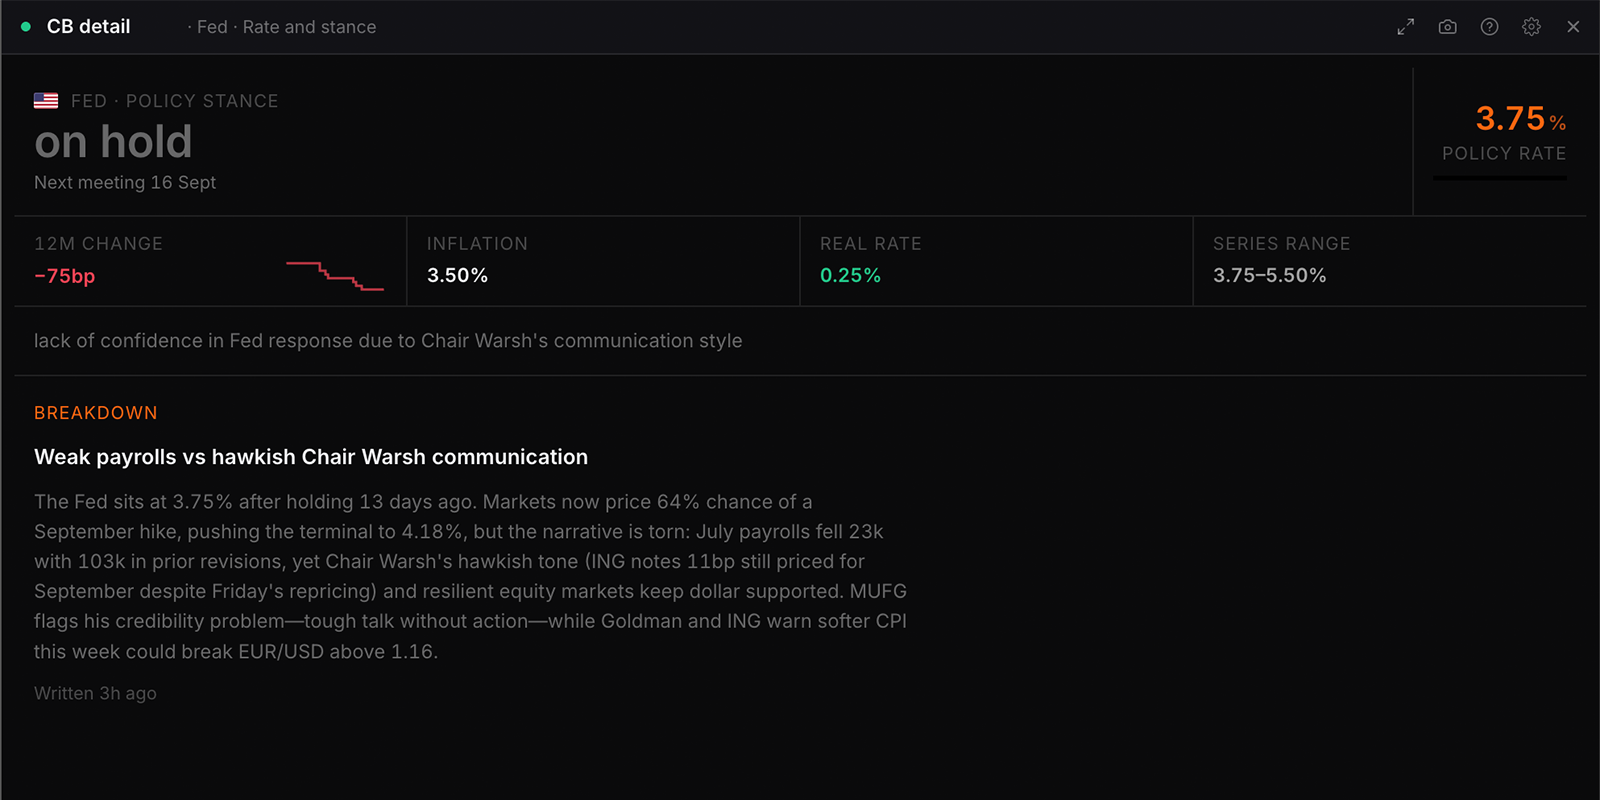
One central bank in depth: policy rate, inflation, real rate, the stance the composite is using, and the next meeting. Switch to the market-implied path for per-meeting cut, hold and hike probabilities, or to the peer view to see where the bank sits on real rates.
Settings
Central bank
Choices are built from whatever the data currently
covers, so the list changes with the markets on the board.
Visualisation
Rate and stancedefault
Market-implied path
Against its peers
Flags
Showdefault
Hide
CB repricing tracker
cb_repricing
Free
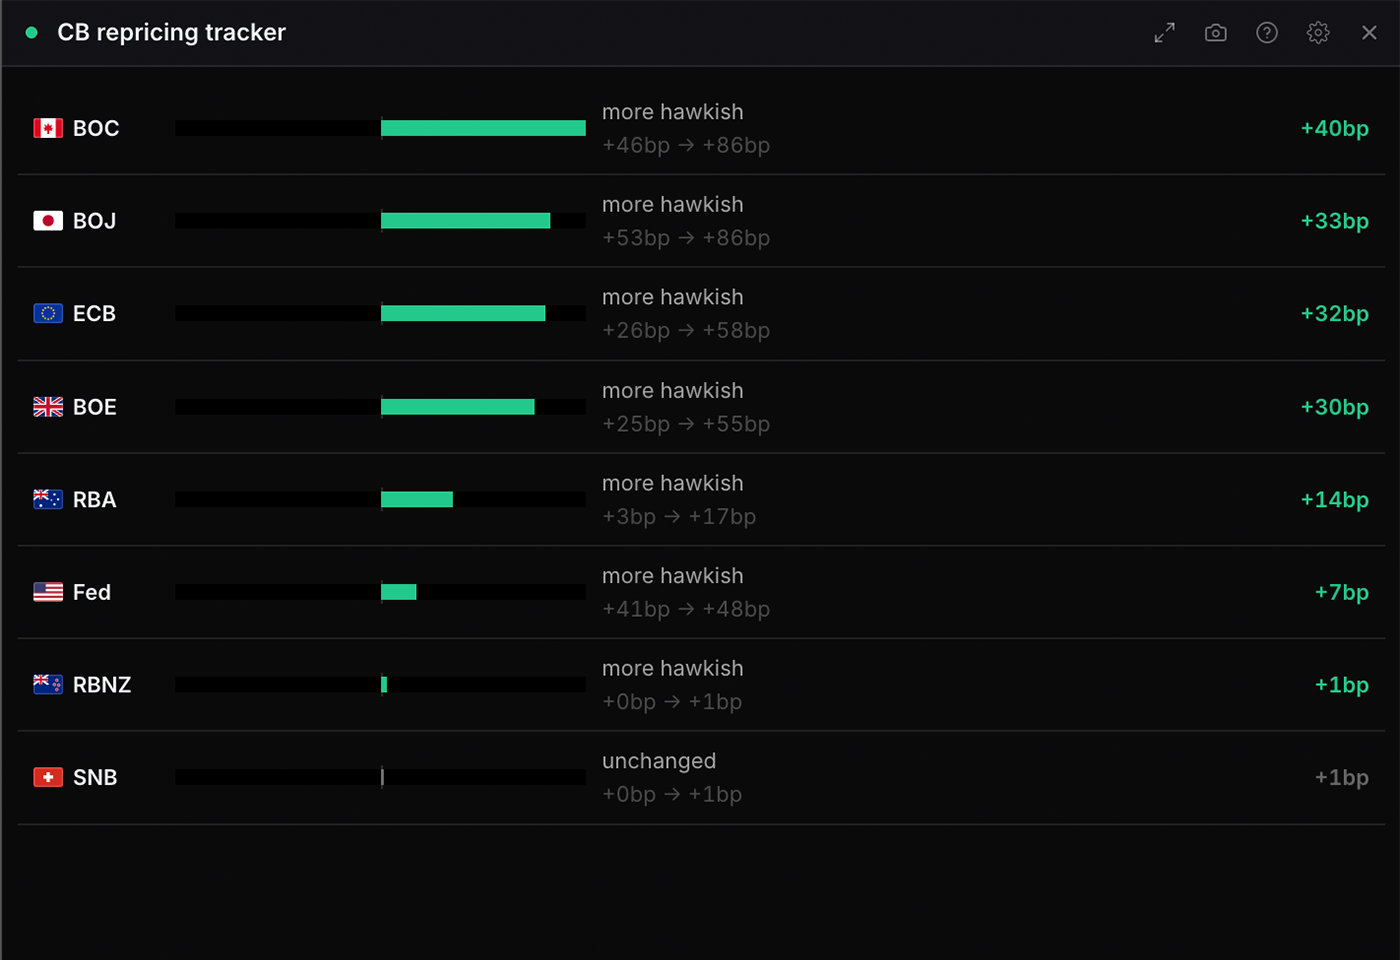
Which central banks the market has repriced most over a chosen lookback. Compares where the market prices each rate path today against where it priced it N days ago, ranked by the size of the shift, and can overlay today's path against the earlier one for a single bank. A repricing is a change in expectation, not a decision.
Settings
Central banks
Shift bars rank who repriced most. Path overlays one bank\u2019s implied rate path today against the same path as it stood at the baseline.
Choices are built from whatever the data currently
covers, so the list changes with the markets on the board.
Window
7 days
30 daysdefault
90 days
Visualisation
Shift bars rank who repriced most. Path overlays one bank\u2019s implied rate path today against the same path as it stood at the baseline.
Shift barsdefault
Path then and now
Table
Central bank
Choices are built from whatever the data currently
covers, so the list changes with the markets on the board.
Carry ranking
carry
Free
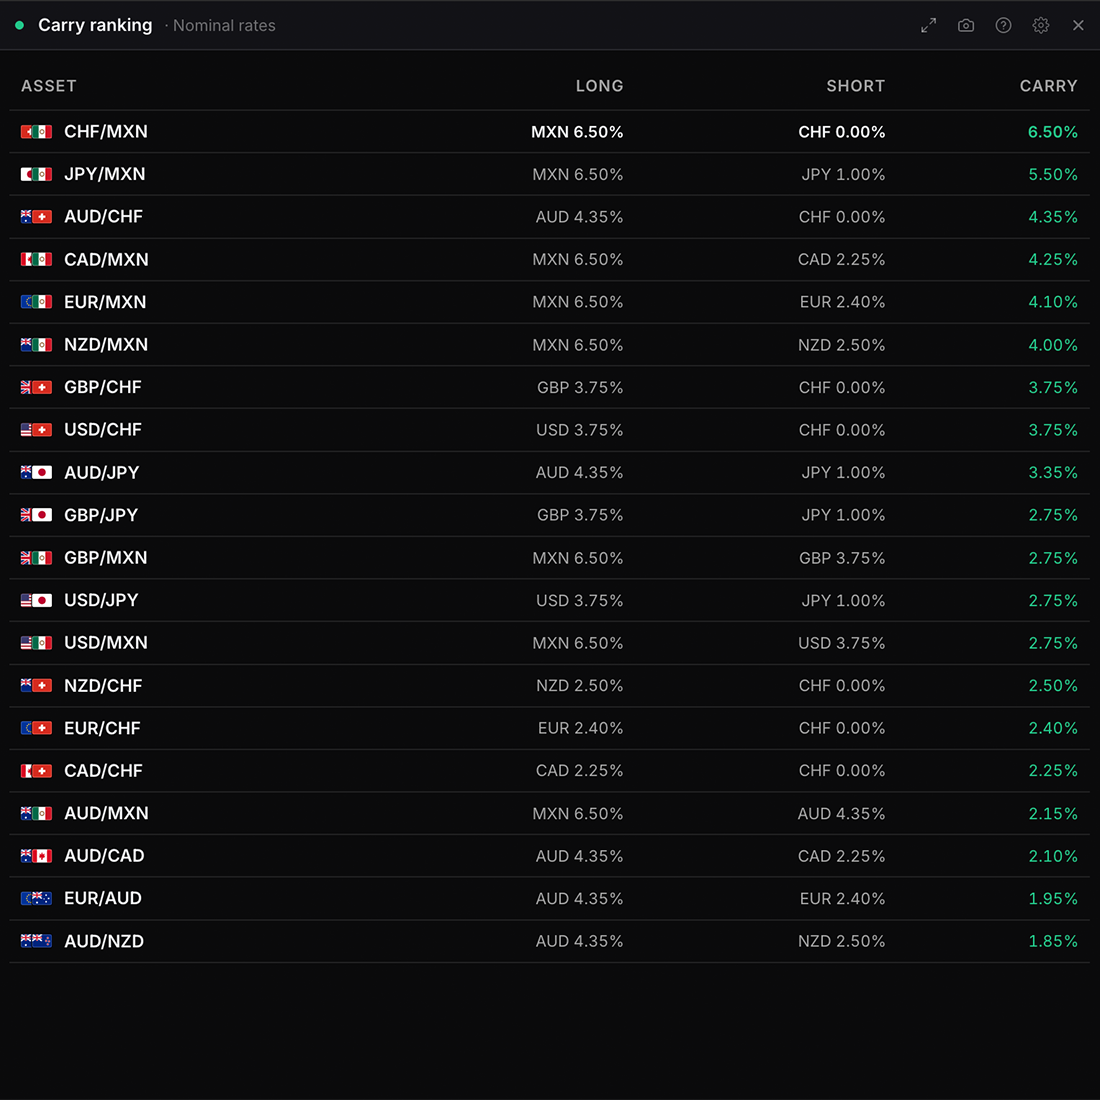
The rate-differential carry for every currency pair, long the higher-yielder and short the lower, ranked. Read it on current policy rates, on real rates with inflation taken out, or on where rates are expected to be in twelve months. Carry is payment for holding the risk that spot moves against you, not a free yield.
Settings
Currencies
Pairs are built from whichever currencies you pick here.
Choices are built from whatever the data currently
covers, so the list changes with the markets on the board.
Carry basis
Real carry subtracts inflation from both legs, so a wide nominal gap can be a negative real one.
Nominal ratesdefault
Real (after inflation)
Forward (12m priced)
Visualisation
Ranked pairsdefault
Carry bars
Pair matrix
Table
Show
Top 10default
Top 20
Every pair
Flags
Showdefault
Hide
Density
Comfortabledefault
Compact
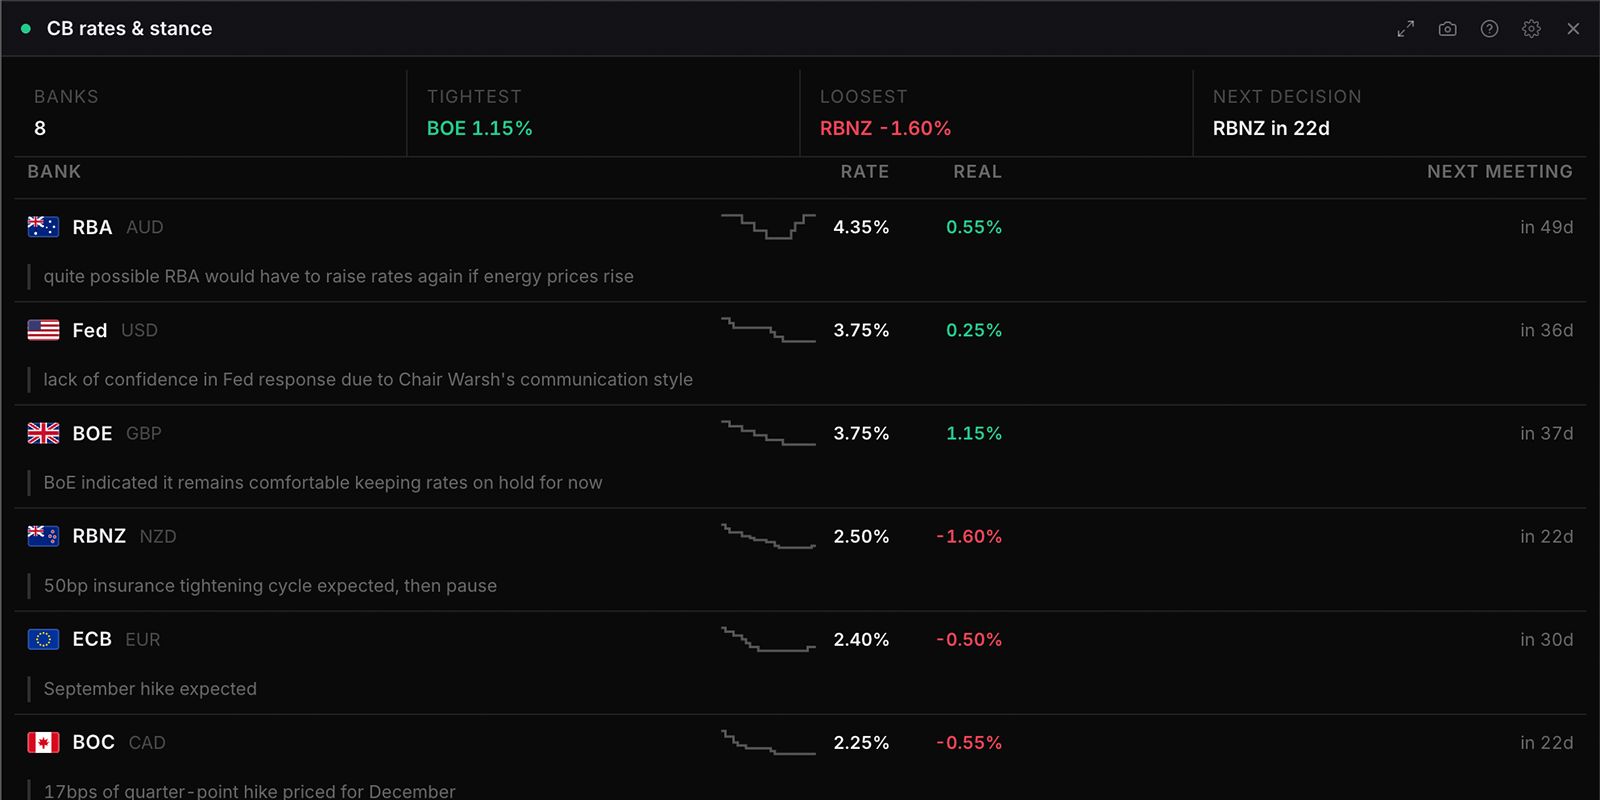
CB rates & stance
cb_stance
Free
Policy rate, real rate, forward stance and next meeting date for the central banks you select, with the rate history and countdowns to each decision. For a ranking of stance alone, use Hawk–dove ranking.
Settings
Central banks
Pick every bank, or just the ones you trade around.
Choices are built from whatever the data currently
covers, so the list changes with the markets on the board.
Visualisation
Real rates subtract headline CPI, which is what actually drives currency flows.
Rate & meeting rowsdefault
Rate comparison
Real rates
Rate history
Meeting countdown
Table
History shown
A policy rate holds between decisions, so a flat stretch is
1 year
2 years
5 yearsdefault
10 years
Everything held
Sort by
Highest ratedefault
Highest real rate
Next meeting
Bank A\u2013Z
Guidance note
The editorial line from bank research, where one exists.
Show
Hidedefault
Flags
Showdefault
Hide
Density
Comfortabledefault
Compact
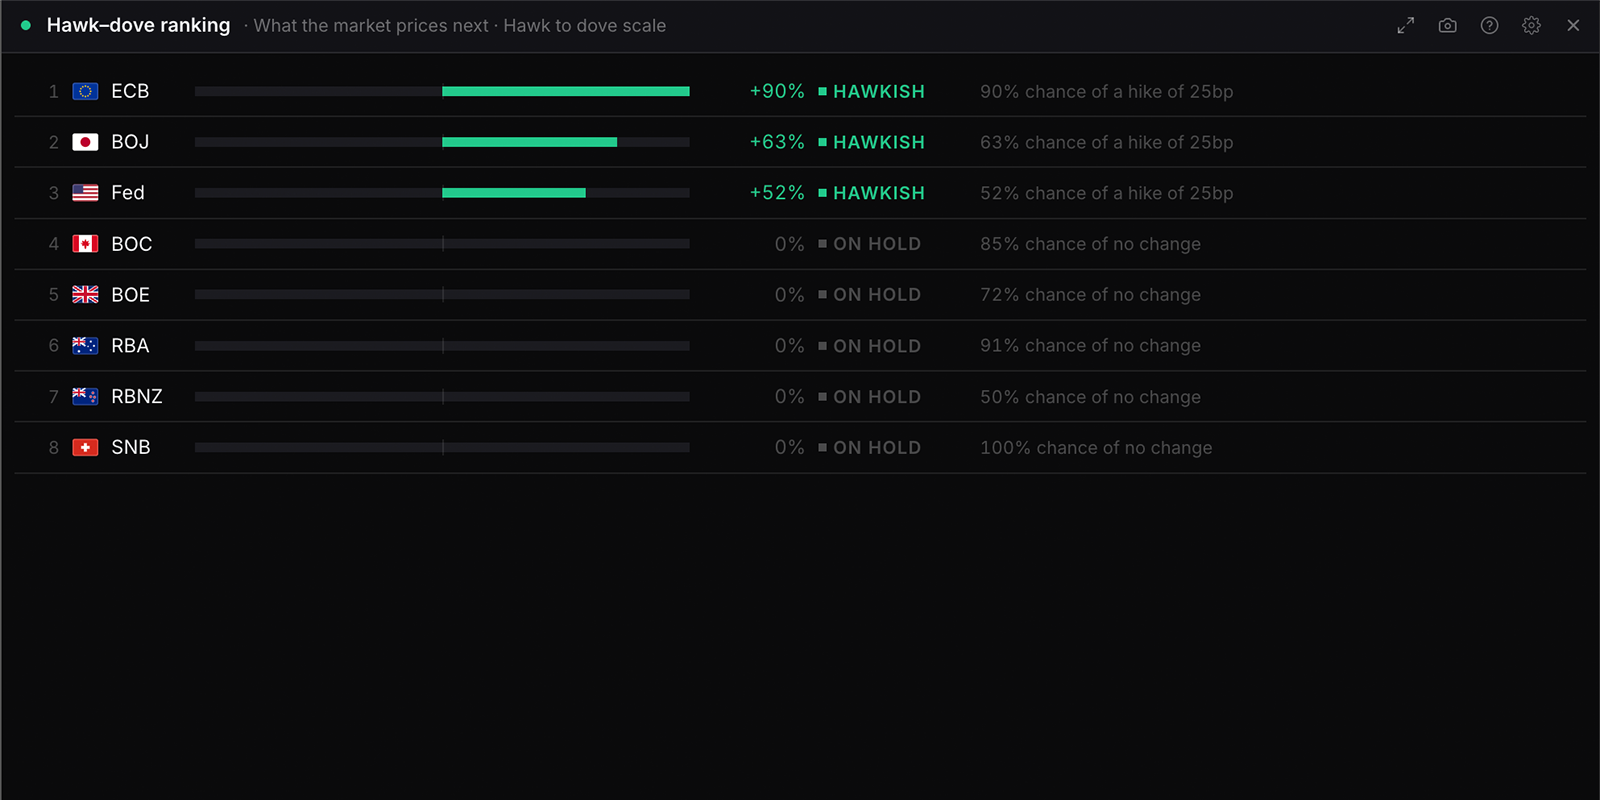
Hawk–dove ranking
cb_hawk_dove
Free
The central banks you select ranked from most hawkish to most dovish, using the same stance reading the composite scores from. The gap between two banks is the policy divergence behind their currency pair.
Settings
Central banks
Pick every bank, or just the ones you trade around.
Choices are built from whatever the data currently
covers, so the list changes with the markets on the board.
Stance measured as
Priced is the signed probability of the next move, which is a market opinion. Real is the policy rate less headline inflation, which is where policy already sits. They often disagree, so they are kept apart rather than blended.
What the market prices nextdefault
Real policy rate
Visualisation
Hawk to dove scaledefault
Plain list
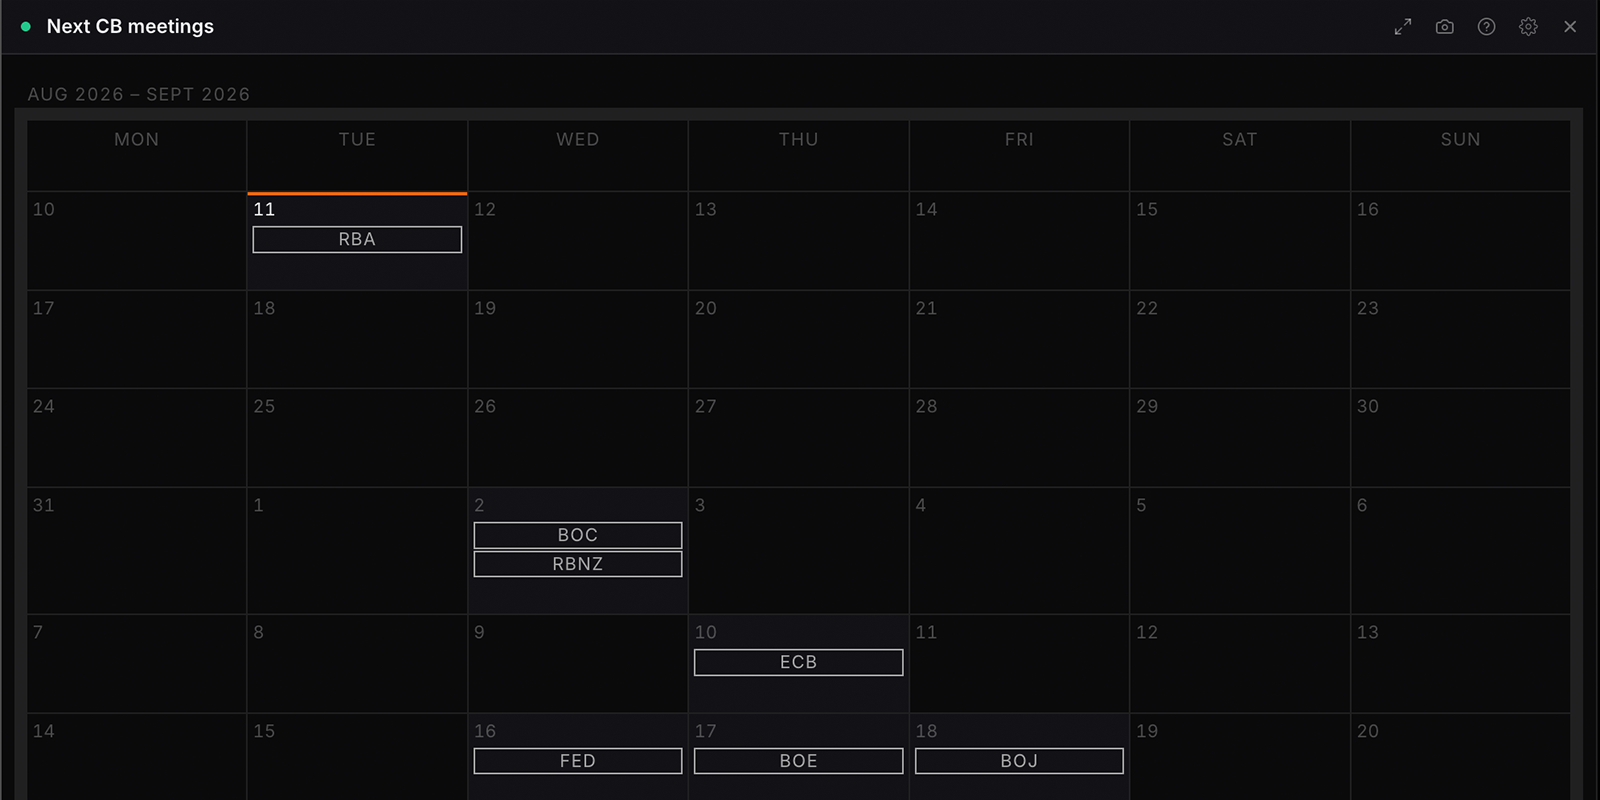
Next CB meetings
cb_next_meetings
Free
Upcoming policy decisions for the central banks you select, ordered by how soon they land. Scheduled meetings only, so an unscheduled decision does not appear here until it is announced.
Settings
Central banks
Choices are built from whatever the data currently
covers, so the list changes with the markets on the board.
Visualisation
A bank that met earlier today keeps reading TODAY for the rest of the day rather than jumping to its next meeting.
List by proximitydefault
Six-week grid
Countdown cards
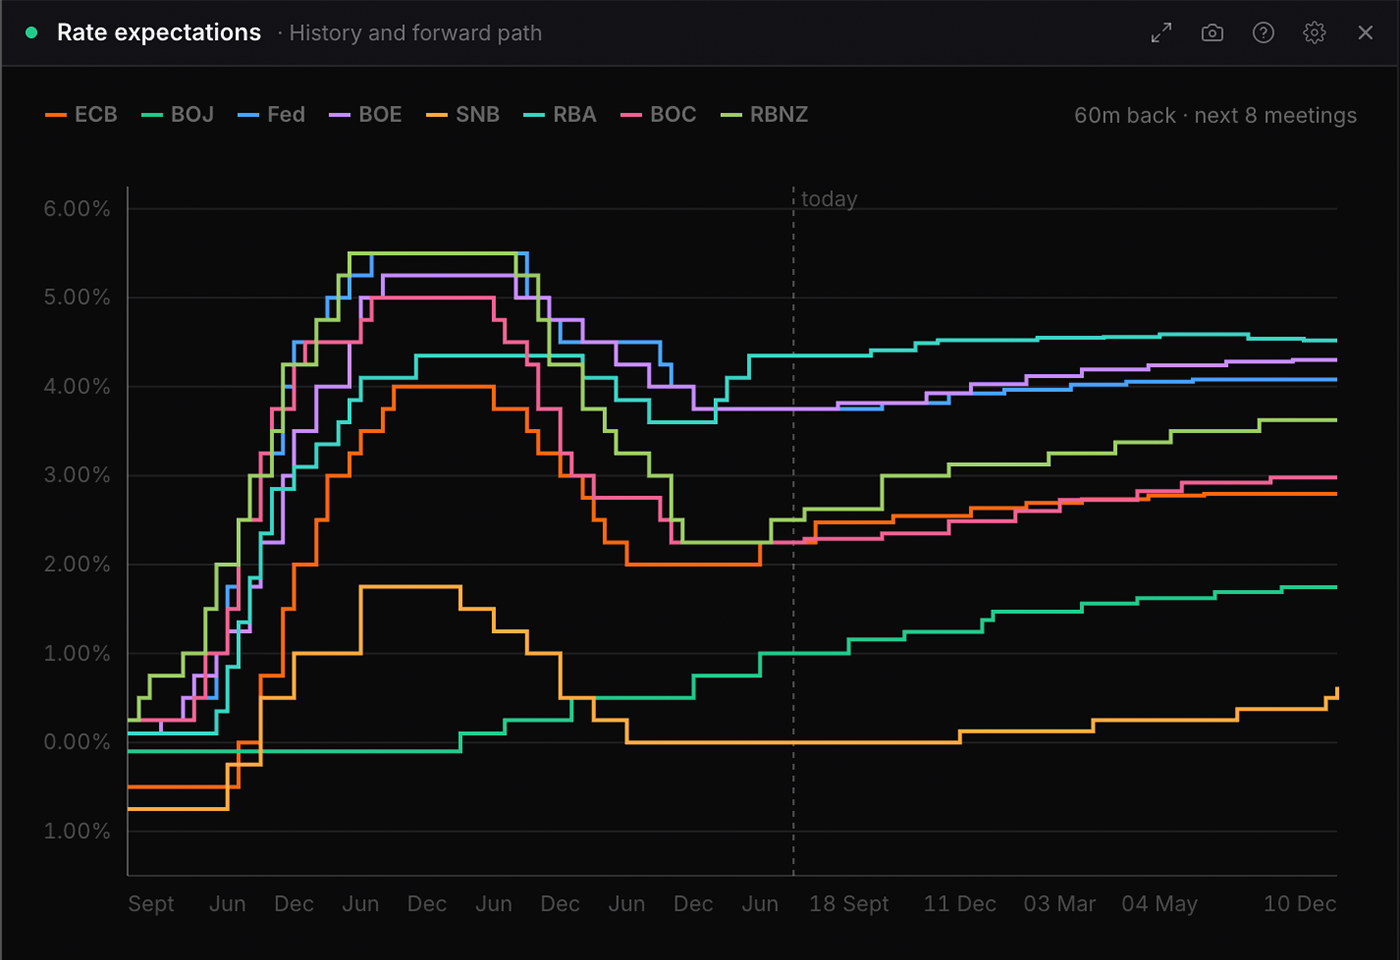
Rate expectations
rate_expectations
Free
What the market expects each central bank to do at its next meeting: cut, hold or hike, with the conviction behind it and the implied rate after the move.
Settings
Central banks
Pick every bank, or just the ones you trade around.
Choices are built from whatever the data currently
covers, so the list changes with the markets on the board.
Visualisation
Hawkish\u2013dovish ranks by direction weighted by conviction, so a marginal hike outranks a certain hold.
Expected movedefault
Conviction bars
Implied rate change
Hawkish \u2013 dovish
Forward path
History and forward path
Bank overview
Meeting schedule
Table
Repricing since
The panel compares today\u2019s priced path against the
A week agodefault
A month ago
Three months ago
History shown
Monthly steps. A policy rate holds between decisions, so a
1 year
2 yearsdefault
5 years
10 years
Horizon
How far down the curve to read. The far end is thinly traded and moves on little volume.
Next 4 meetings
Next 8 meetingsdefault
Full curve
Minimum conviction
Hides banks where the market has not made its mind up.
Anydefault
Above 60%
Above 80%
Sort by
Most hawkishdefault
Most dovish
Highest conviction
Bank A\u2013Z
Flags
Showdefault
Hide
Density
Comfortabledefault
Compact
Rates & yields
2 widgets
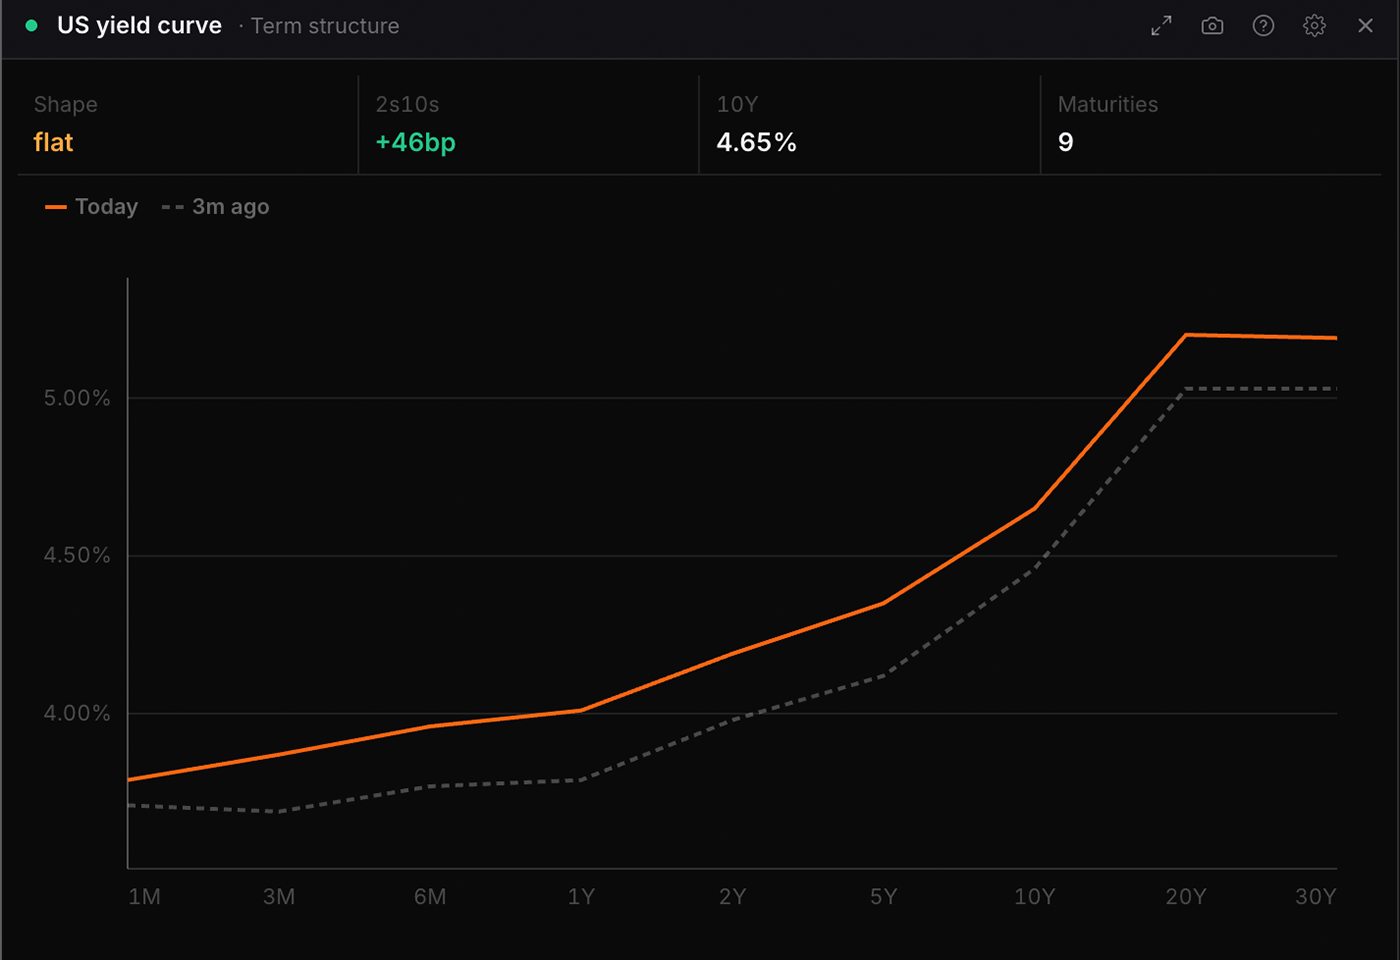
US yield curve
yield_curve
Pro
The US Treasury curve: its current shape, the key spreads (2s10s, 3m10s, 5s30s) and their recent history, real yields against CPI year on year, and whether any part of the curve is inverted. US Treasuries only; the other currencies' curves sit inside each currency's drilldown.
Settings
Visualisation
Term structuredefault
Spreads
Real yields
Spread history
Table
Compare with
Today onlydefault
1 week ago
1 month ago
3 months ago
Spread
Choices are built from whatever the data currently
covers, so the list changes with the markets on the board.
Line style
Linedefault
Area
Baseline (+/-)
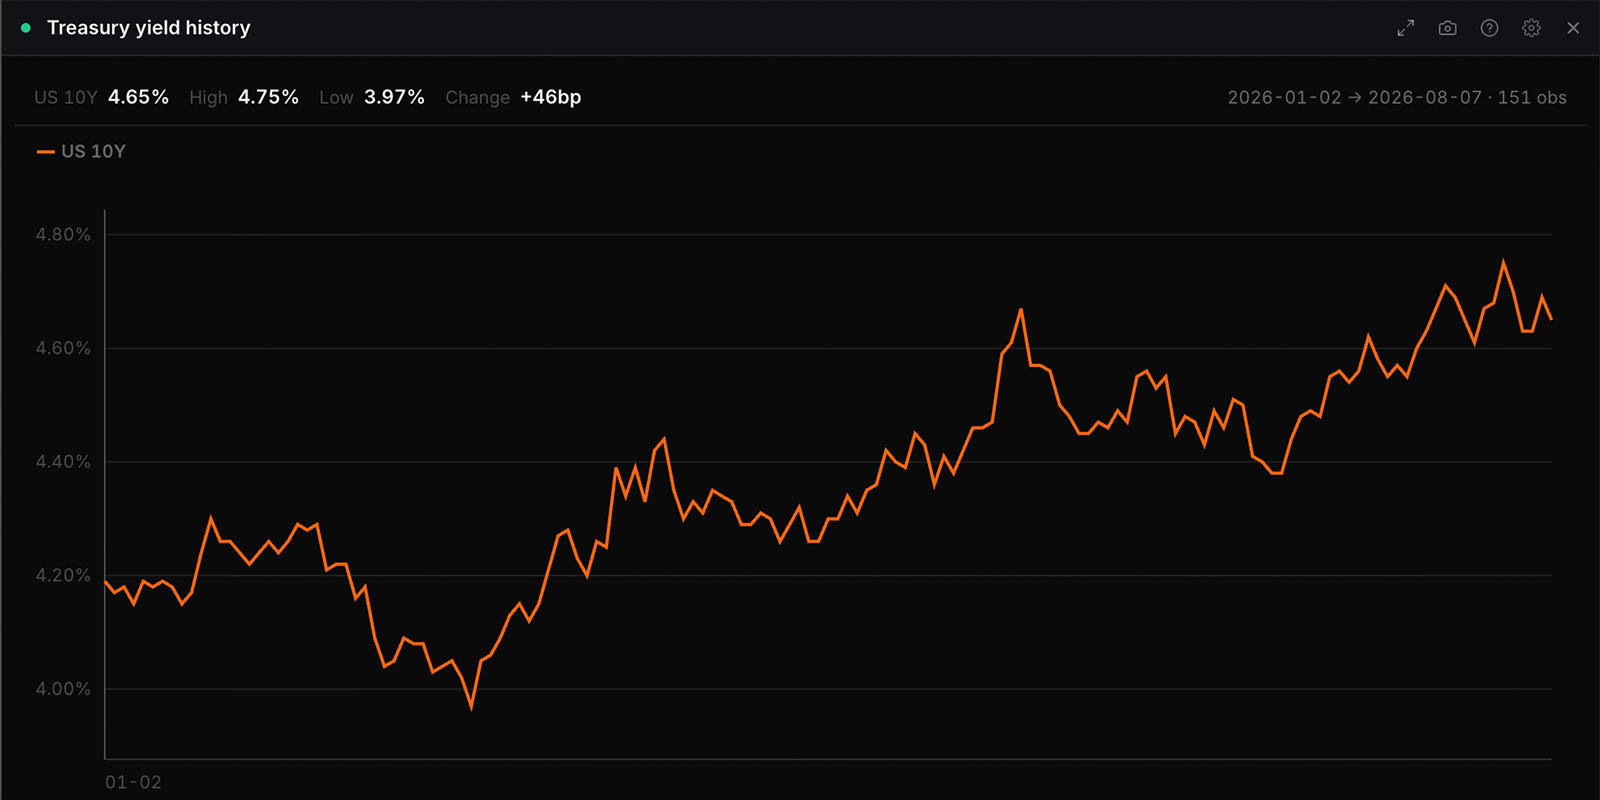
Treasury yield history
bond_chart
Pro
One maturity through time, as a yield or as the move in basis points across the window. Windows run from one month to the full published series, which begins in 1962 for the ten year. High, low, net change and the range actually drawn sit in the header. US Treasuries only.
Settings
Maturity
Choices are built from whatever the data currently
covers, so the list changes with the markets on the board.
Window
Max is the full published series, which begins in 1962 for the ten year.
1 month
3 monthsdefault
6 months
1 year
Year to date
5 years
Max
Show
Yielddefault
Change across window (bp)
Crosses
5 widgets
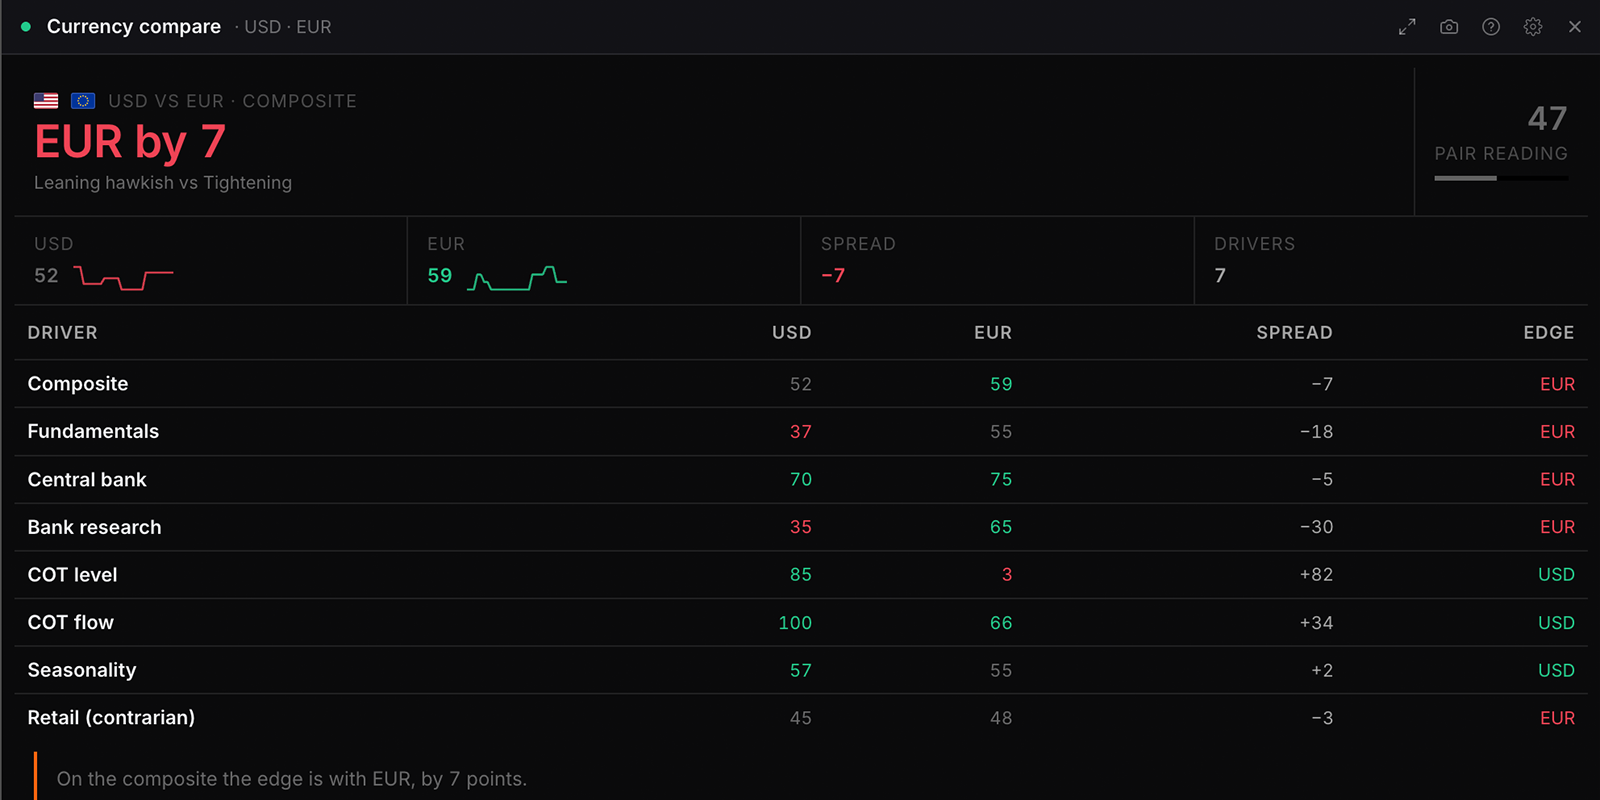
Currency compare
currency_compare
Free
Two currencies set against each other: composite scores, the drivers behind them, central bank stance and COT positioning. The gap between the two legs is what a pair score is built from, so this is that calculation shown open.
Settings
Currency A
Choices are built from whatever the data currently
covers, so the list changes with the markets on the board.
Currency B
Choices are built from whatever the data currently
covers, so the list changes with the markets on the board.
Visualisation
Side by sidedefault
Shape overlay
Spread table
Flags
Showdefault
Hide
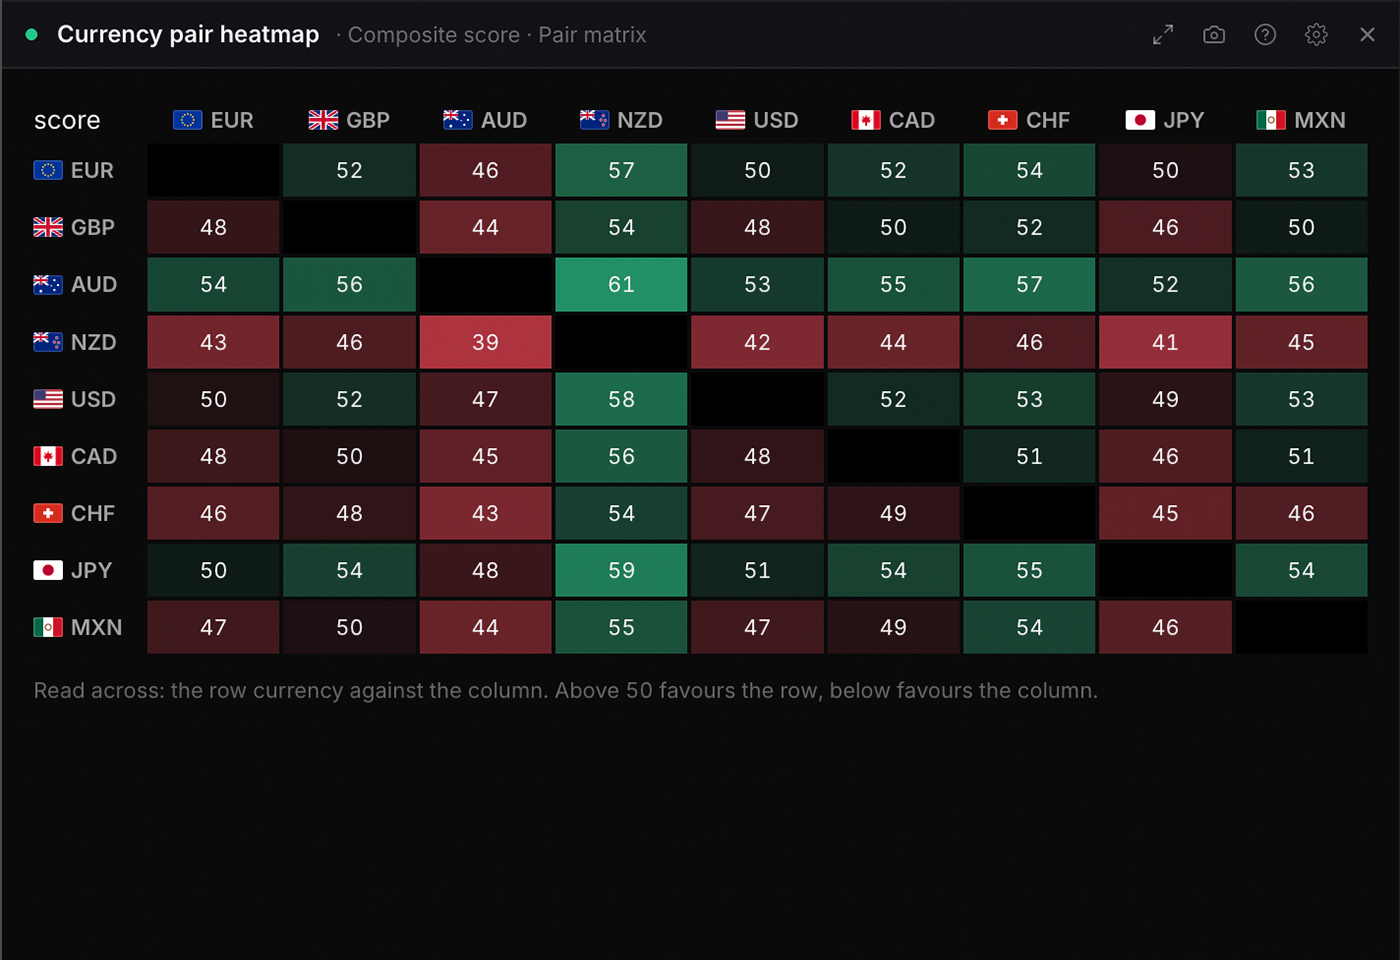
Currency pair heatmap
pair_heatmap
Free
The full pair score matrix across the major currencies, with the strongest edges called out. Each cell is the directional gap between the two legs, so the matrix is the pair score calculation laid out in one grid.
Settings
Currencies
Pairs are built from whichever currencies you pick here.
Choices are built from whatever the data currently
covers, so the list changes with the markets on the board.
Measure
Switch the grid to a single driver to see which pairs have the widest divergence on it.
Composite scoredefault
Retail (contrarian)
Visualisation
Pair matrixdefault
Strongest edges
Edge bars
Table
Show
Top 10default
Top 20
Every pair
Flags
Showdefault
Hide
Density
Comfortabledefault
Compact
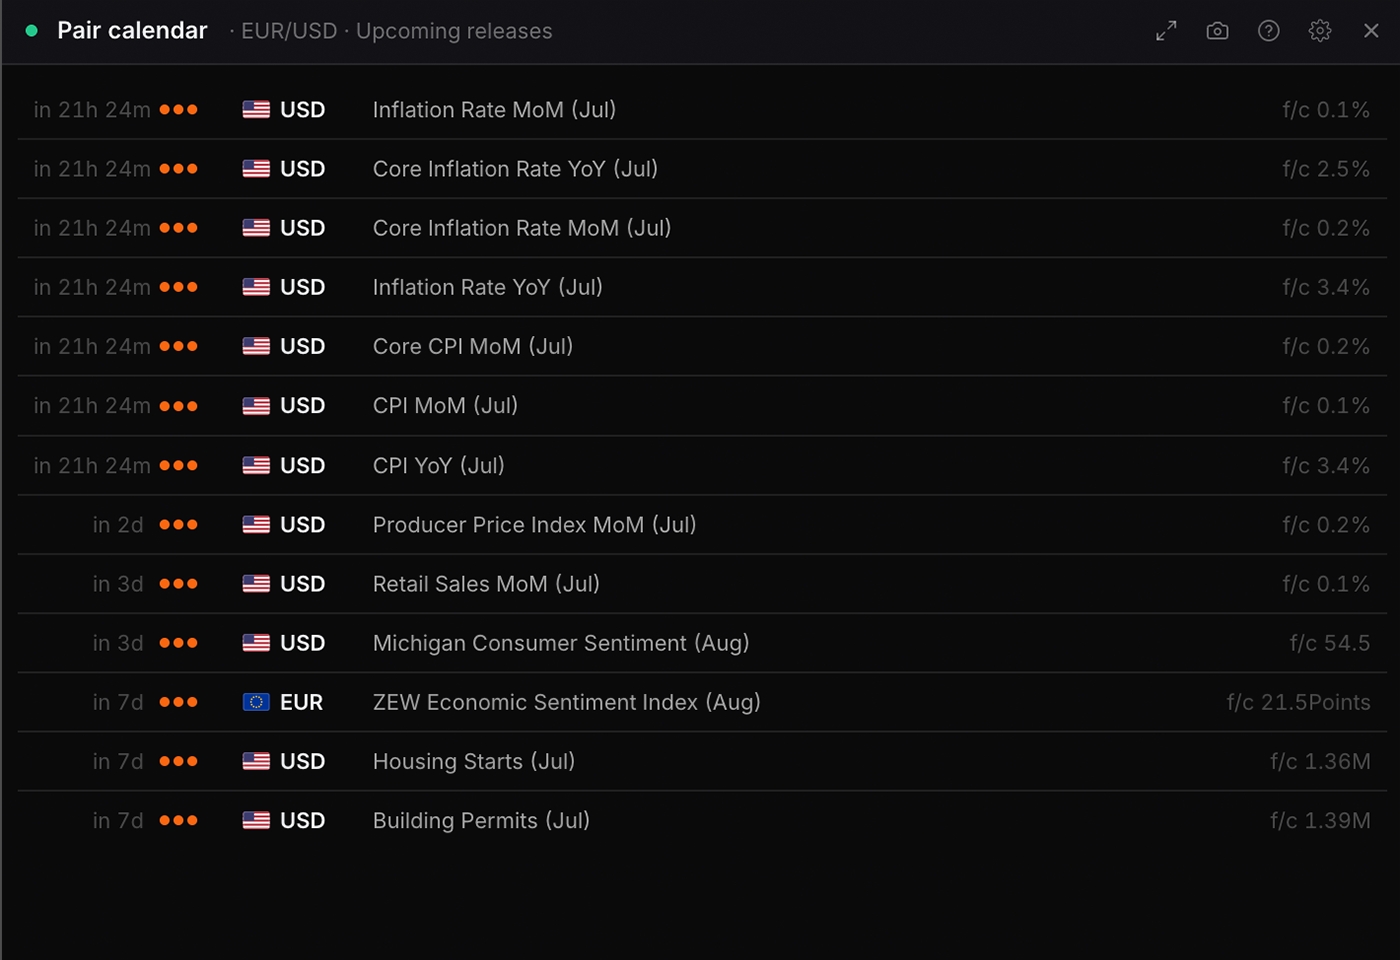
Pair calendar
pair_events
Free
The economic calendar filtered to one pair, covering both the base and quote currencies. Shows forecast and previous ahead of each release, and the actual once it prints.
Settings
Pair
Choices are built from whatever the data currently
covers, so the list changes with the markets on the board.
Window shown when view is upcoming
Next 48 hoursdefault
Next 7 days
Next 14 days
Impact shown when view is upcoming
All events
Medium and highdefault
High only
Visualisation
The average move is the size of the move on release day, not its direction: the server averages absolute changes.
Upcoming releasesdefault
What moves this pair
Forecast record
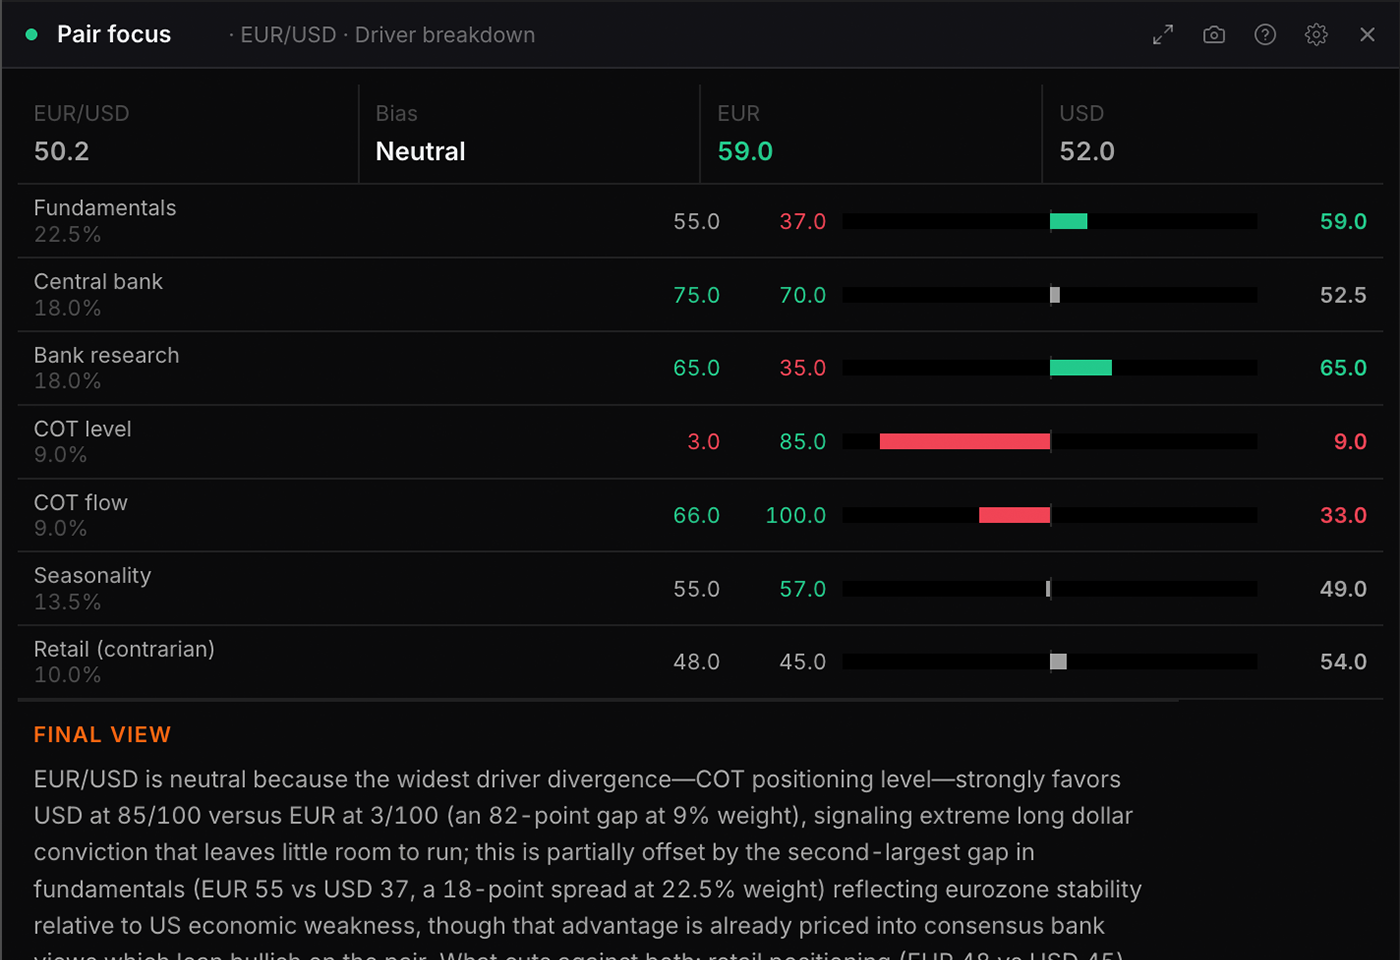
Pair focus
pair_focus
Free
The full breakdown for one pair: the composite score, both currencies' components set side by side, central bank stance, COT positioning and the written read on each leg. Opens to the full deep-dive.
Settings
Pair
Choices are built from whatever the data currently
covers, so the list changes with the markets on the board.
Visualisation
The pair score is not base minus quote. Each driver is folded through 50 + half the gap, then weighted, so the driver rows show how the headline is actually built.
Driver breakdowndefault
Legs side by side
Table
Final view
The engine\u2019s written read on the pair as a whole, weighing the two legs against each other. It needs the AI explain feature on your plan.
Showdefault
Hide
Research snaps
Short per-currency synthesis from uploaded research. Currencies with no stored research show nothing rather than an empty block.
Showdefault
Hide
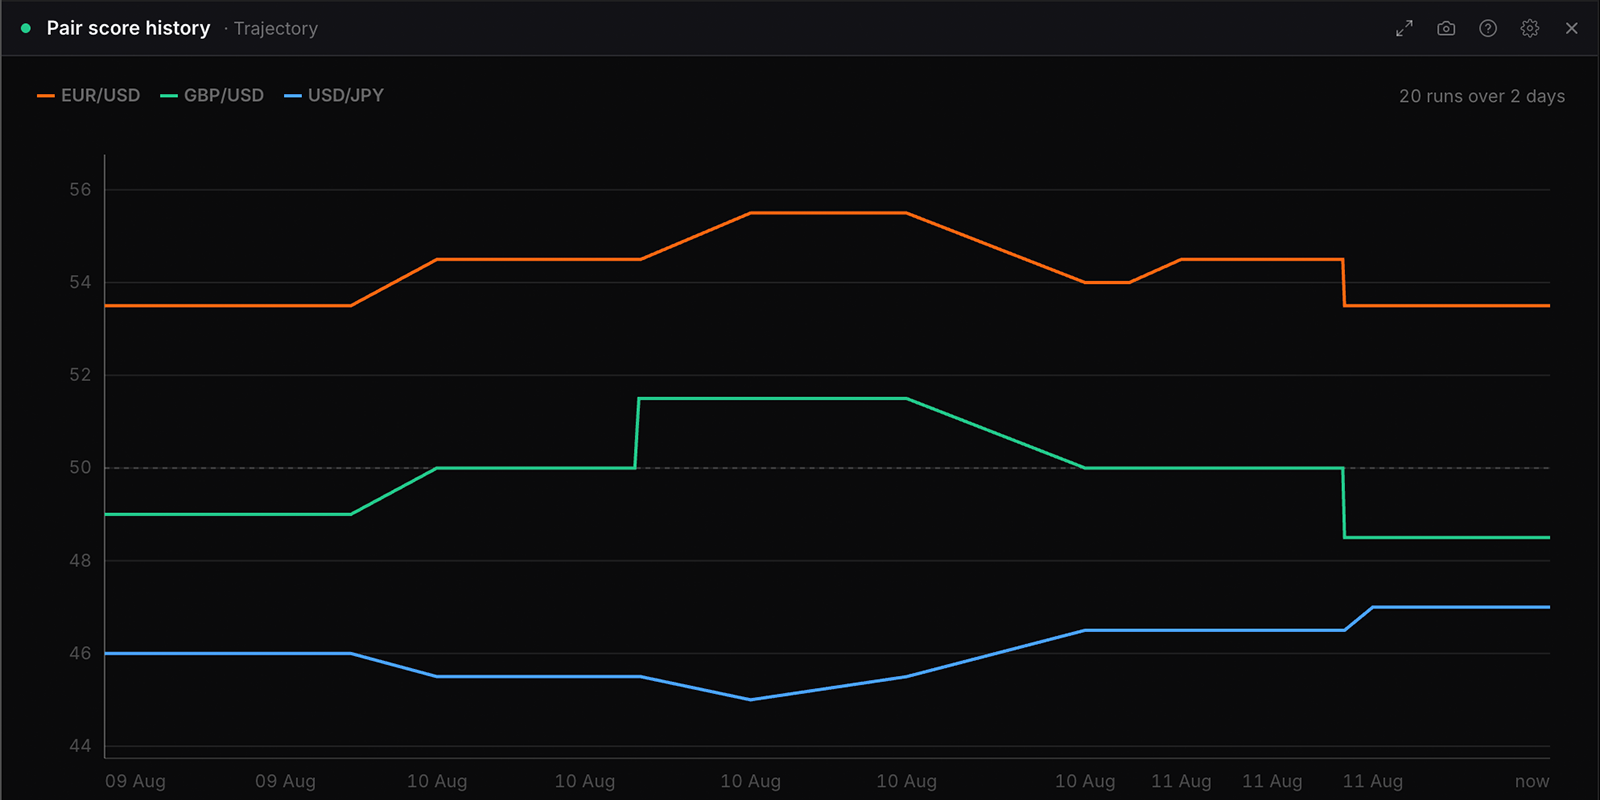
Pair score history
pair_score_history
Free
Composite pair score over time for the pairs you select. Derived from the two per-currency score histories, folded the same way every pair score is: 50 plus half the gap between base and quote. Shows directional pair bias drifting across the snapshot history.
Settings
Crosses
Overlay as many pairs as you like; the legend toggles each one.
Choices are built from whatever the data currently
covers, so the list changes with the markets on the board.
Visualisation
Trajectorydefault
Change over window
Table
Window
The engine keeps roughly the last 30 scoring runs.
Last 10 runs
Last 20 runsdefault
Everything held
Flags
Showdefault
Hide
Positioning
13 widgets
Who is holding what, and how stretched they are. Two different crowds sit here and they behave differently: the large speculators in the weekly CFTC Commitments of Traders report, who mostly follow trends, and the retail book, which mostly fades them. Positioning tells you how much of a move is already owned. It does not tell you when the crowd gives up, and nothing in this category should be read as timing.
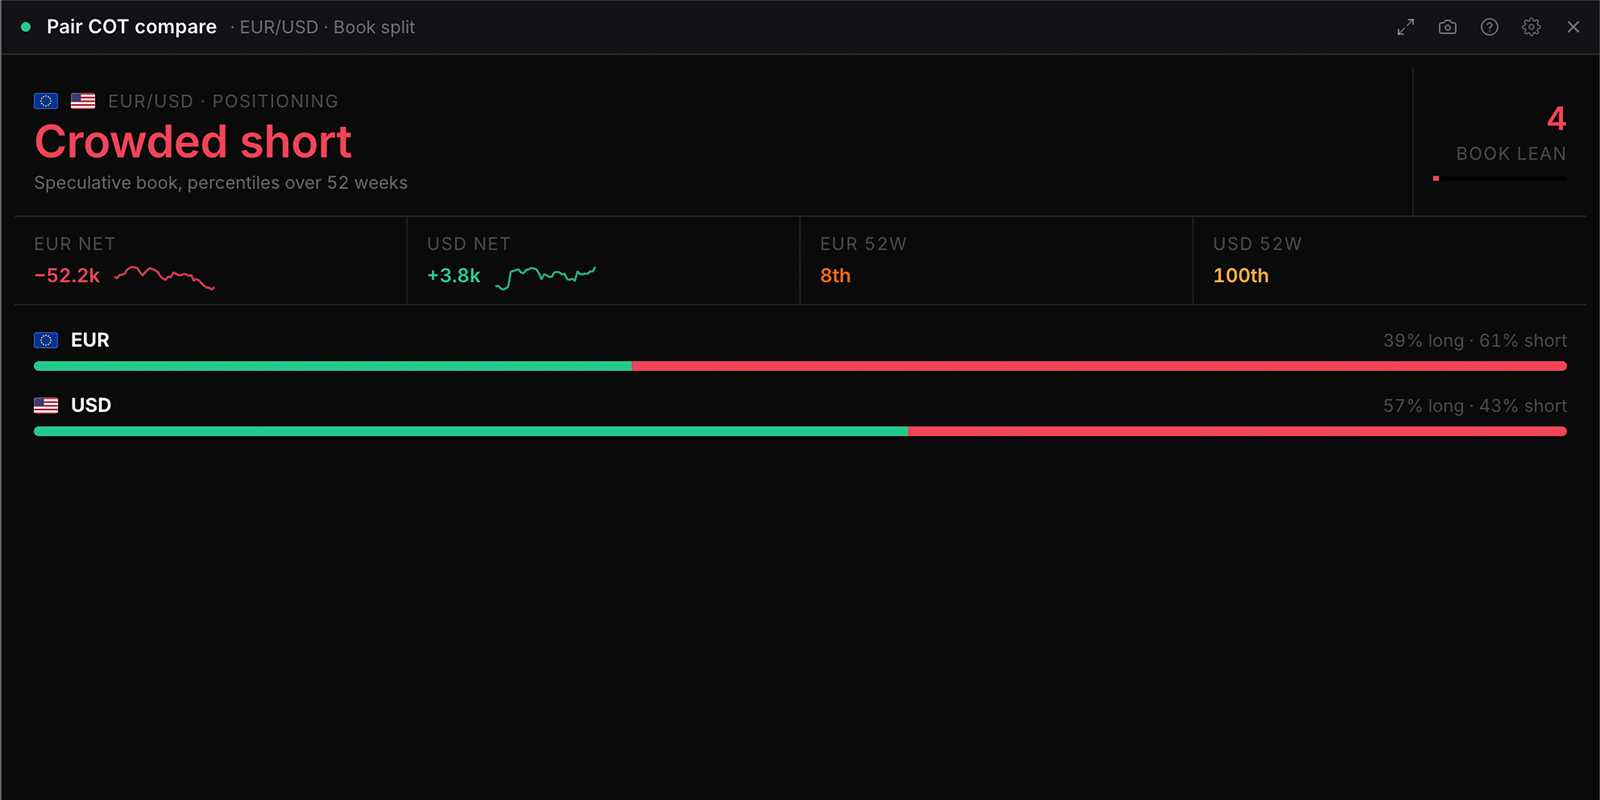
Pair COT compare
pair_cot_compare
Free
Base vs quote COT positioning side by side: net position, 52w percentile, and long/short split for both legs of a pair.
Settings
Pair
Choices are built from whatever the data currently
covers, so the list changes with the markets on the board.
Visualisation
Book splitdefault
Table
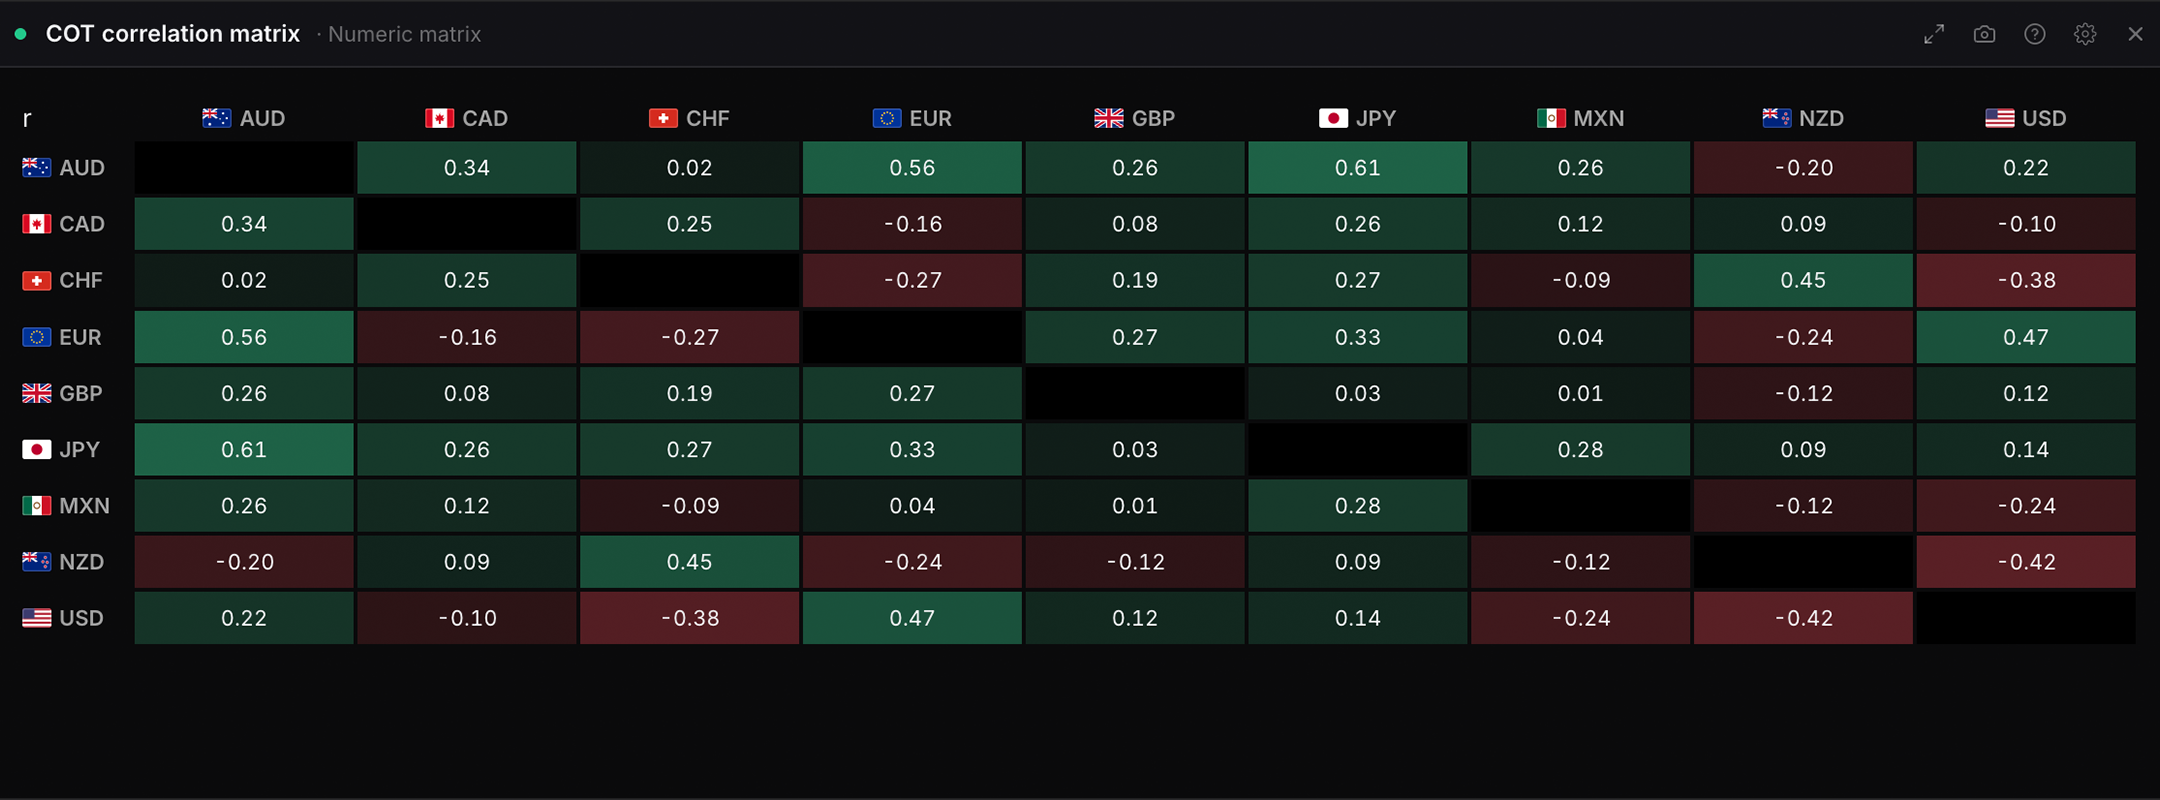
COT correlation matrix
pair_correlation
Free
26-week rolling correlation between COT positioning changes across currencies. Identifies which currencies are moving together (high positive correlation = doubling up on the same trade) and which are diverging (negative correlation = good portfolio offsets).
Settings
Window
Correlation is measured on week-on-week CHANGES in net positioning, not on the levels. Levels trend for months and would read as correlated even when the two are unrelated.
Choices are built from whatever the data currently
covers, so the list changes with the markets on the board.
Window
13 weeks
26 weeksdefault
52 weeks
Visualisation
Correlation is measured on week-on-week CHANGES in net positioning, not on the levels. Levels trend for months and would read as correlated even when the two are unrelated.
Numeric matrixdefault
Colour only
Ranked pairs
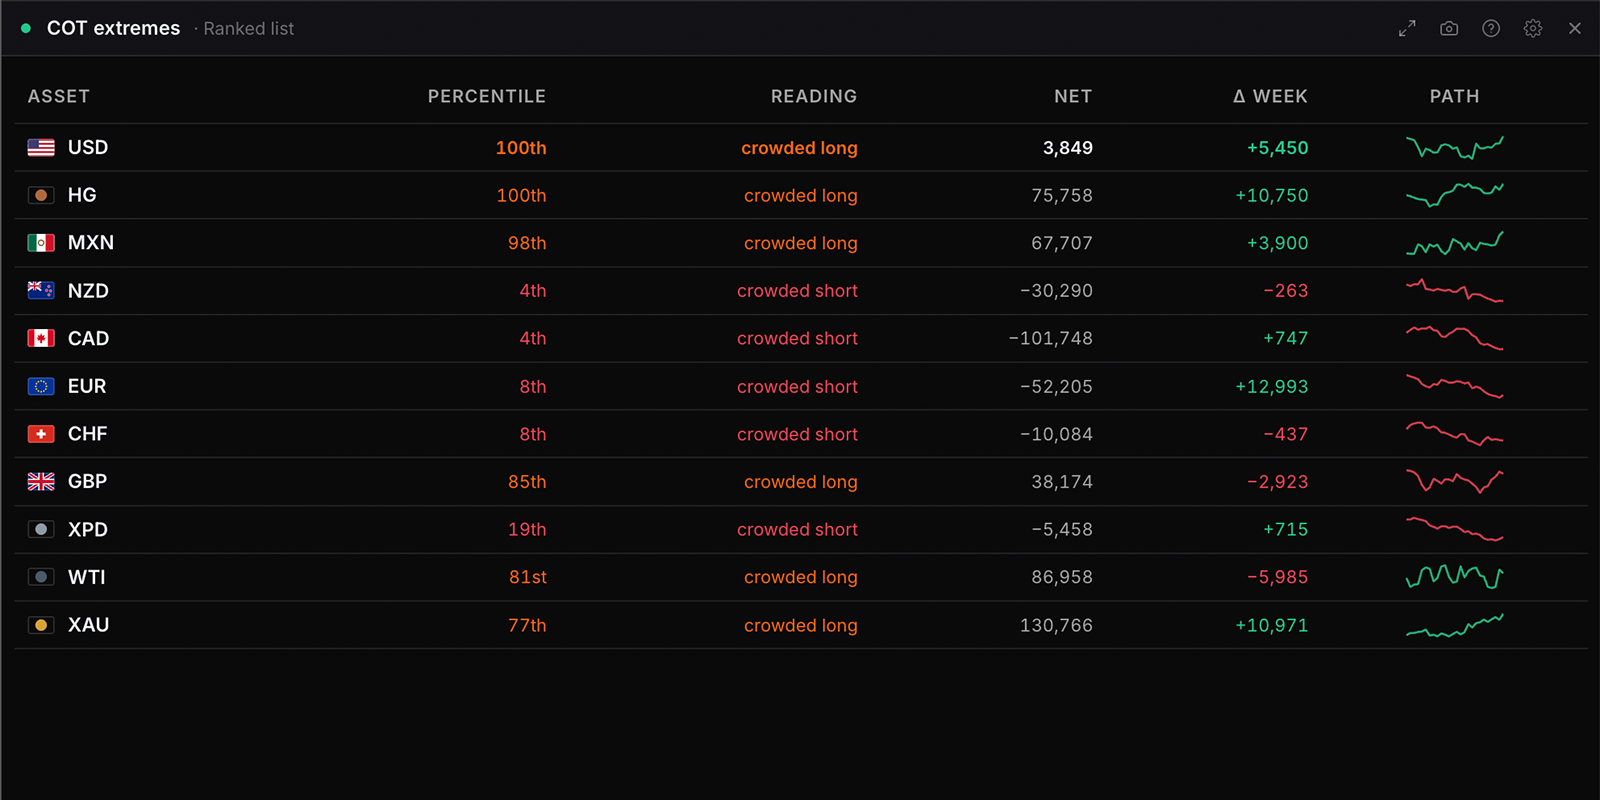
COT extremes
cot_extremes
Free
Currencies sitting at the extremes of their own COT percentile range, with net contracts, the weekly change and the reading behind each. Adjust the severity threshold to widen or narrow the filter. An extreme marks a crowded position, not a timed reversal.
What the data is
Every tracked market ranked by how far its speculative net position sits within its own 52 week range, expressed as a percentile. The 100th percentile is the most net long that market has been in a year; the 0th is the most net short.
Measuring against each market’s own history is what makes the ranking comparable. Gold and the New Zealand dollar trade in completely different contract sizes, so their raw net figures cannot be set beside each other. Their percentiles can.
Same source and same lag as the COT table: published Friday, measured the previous Tuesday.
How to read it
This is the fastest way to find where the crowd is concentrated without opening one market at a time. Read it as a shortlist rather than a signal: the markets at either end are the ones where a surprise has the most positioning to unwind.
It is most useful held against a view you already have. A macro case for a currency that is also sitting at the 5th percentile is a very different proposition from the same case at the 95th, because in the second one the trade is already on and you are late to it.
Settings
Threshold
Looser thresholds catch more setups; stricter keeps only the most stretched positioning.
Loose (70 / 30)
Standard (80 / 20)default
Tighter (85 / 15)
Strict (90 / 10)
Visualisation
Ranked listdefault
Centred bars
Percentile against net
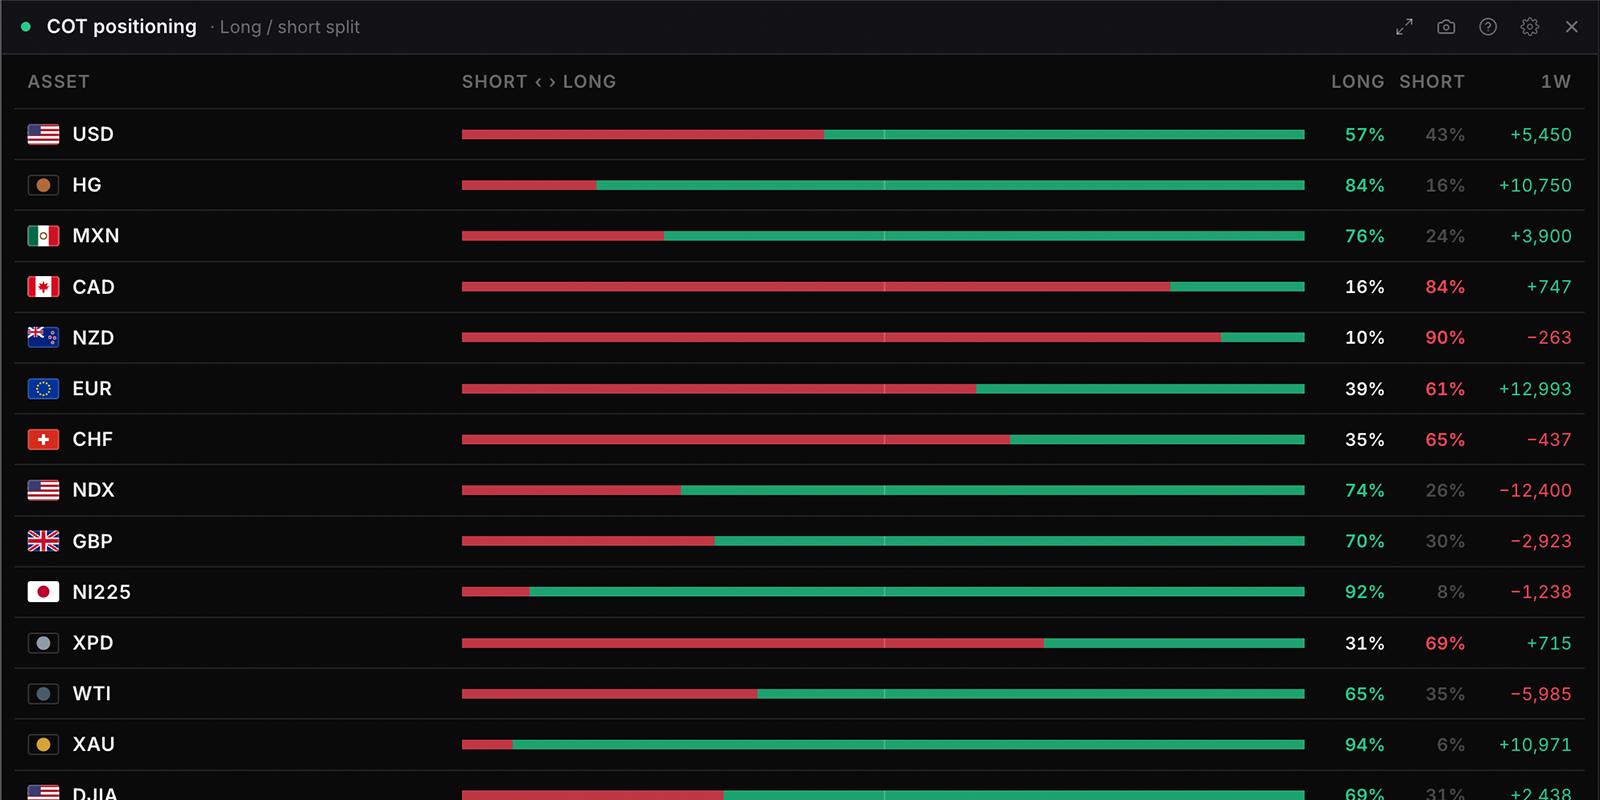
COT positioning
cot_snapshot
Free
CFTC Commitment of Traders positioning across selected assets: where speculative positioning sits against its own history, the long and short split behind it, and how crowded each side has become. Weekly data, published Friday for the preceding Tuesday. For the same positioning over time, use COT positioning chart.
Settings
Visualisation
Scatter plots percentile against the weekly shift, so a crowded position that is still building shows up top-right.
Choices are built from whatever the data currently
covers, so the list changes with the markets on the board.
Visualisation
Scatter plots percentile against the weekly shift, so a crowded position that is still building shows up top-right.
Rowsdefault
Ranked bars
Columns
Heatmap
Radar
Crowding scatter
Long / short pie
Table
Show
Split shows how the speculative book is divided. Percentile ranks the current net against its own history.
Long / short splitdefault
Net contracts
Percentile rank
Percentile window
How far back the percentile and extremes are measured.
26 weeks
52 weeksdefault
All history
Sort by
Most stretcheddefault
Biggest weekly shift
Net position
Code A\u2013Z
Weekly change
Net position versus the prior release.
Showdefault
Hide
Flags
Showdefault
Hide
Density
Comfortabledefault
Compact
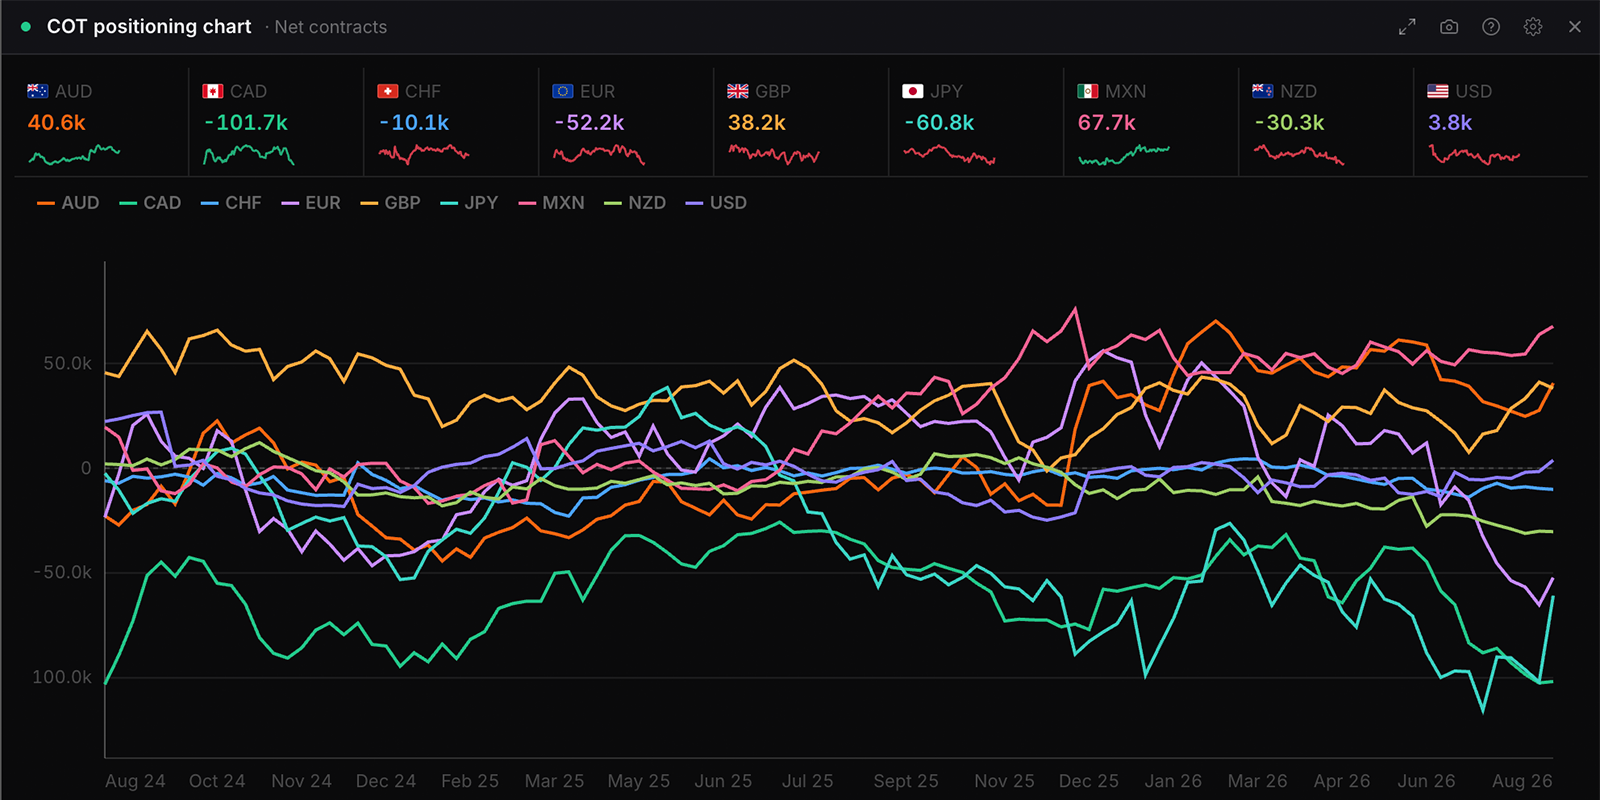
COT positioning chart
cot_chart
Free
CFTC Commitment of Traders positioning over time. Chart one metric for a single asset, or compare several assets at the latest week or across their history. Weekly data, published Friday for the preceding Tuesday.
Settings
Metric
Net is longs minus shorts. Shares are each side as a percentage of open positions.
Choices are built from whatever the data currently
covers, so the list changes with the markets on the board.
Metric
Net is longs minus shorts. Shares are each side as a percentage of open positions.
Choices are built from whatever the data currently
covers, so the list changes with the markets on the board.
History
6 months
1 year
2 yearsdefault
5 years
All
Visualisation
Linedefault
Area
Baseline (+/-)
Columns
Long / short split
Table
Zero line
Showdefault
Hide
COT table
cot_table
Free
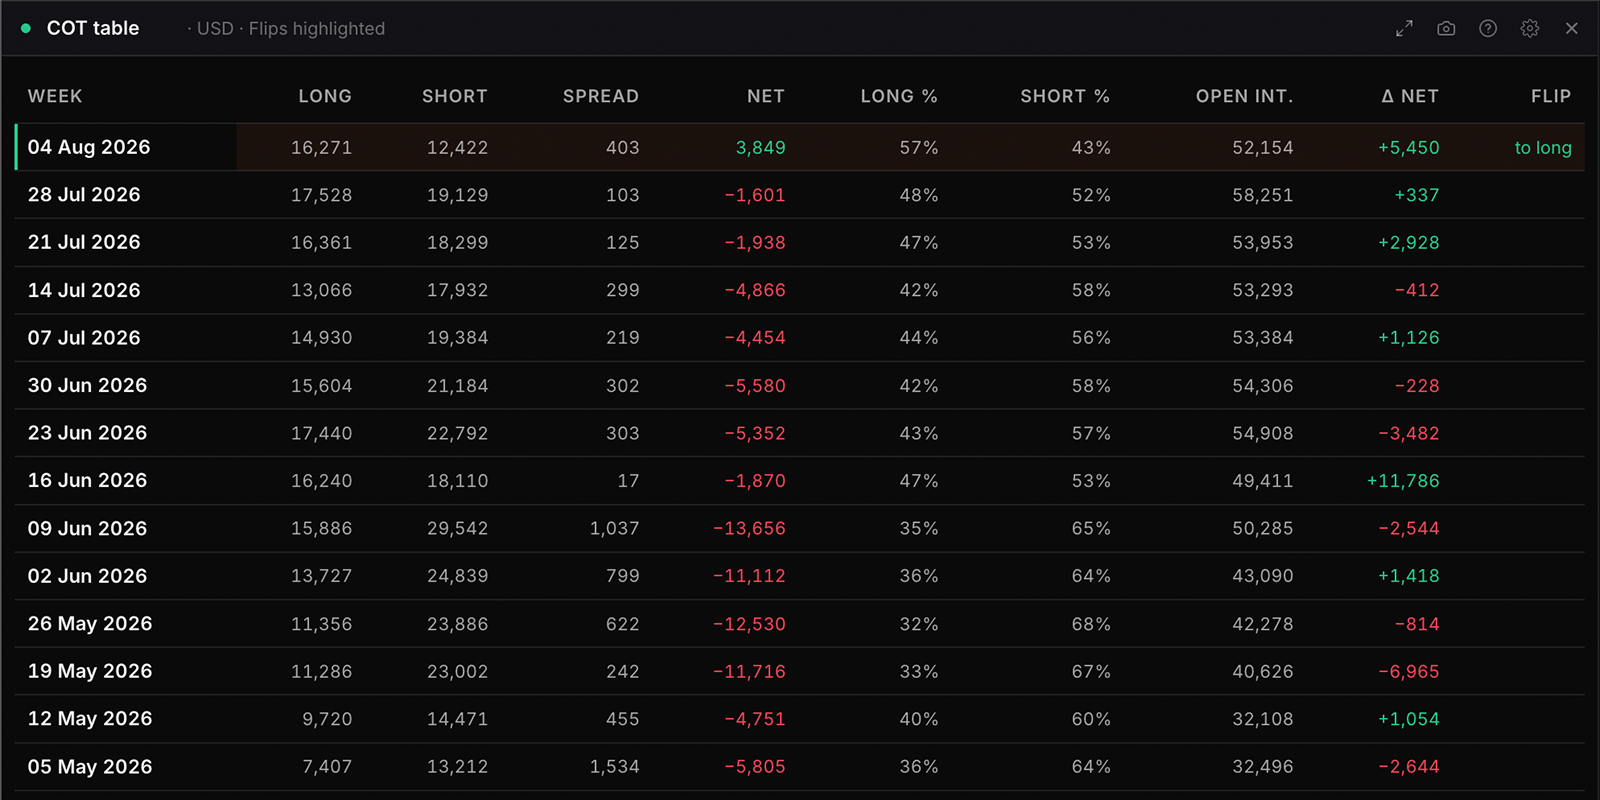
Weekly CFTC Commitment of Traders data for one currency, week by week: positioning, the change on each week, and the weeks where net positioning flipped from one side to the other. Choose how far back to read.
What the data is
The weekly Commitments of Traders report from the US Commodity Futures Trading Commission, for one market at a time. Every row is one reported week: long contracts, short contracts, the net between them, and the change on the week.
Two things about the timing matter more than anything on the screen. The report is published on a Friday afternoon US time and it describes positions as they stood at the close of the PREVIOUS Tuesday. So the freshest row you can ever see is three days old on arrival, and six days old by the following Thursday. In a fast week the picture has often changed before you read it.
It also covers futures only. The spot FX market is far larger and traded over the counter, where the CFTC cannot see it. Currency futures are a real and useful sample of speculative flow. They are not the whole market.
How to read it
Read the change and the range, not the level. A net long of 80,000 contracts means nothing on its own; the same figure is unremarkable near the middle of its own 52 week range and a warning near the top of it.
The flips view is the one most people miss. A market that has just crossed from net short to net long has changed hands, and the week it happened is usually more informative than the level it reached.
The misreading to avoid: crowded is not the same as wrong. A consensus long can keep being the correct trade for months. What an extreme tells you is that the market is fragile and that the fuel to push it further is running low, not that it is about to turn.
Settings
Asset
Which market the table reads. One at a time, because the point of this widget is week-by-week detail rather than a comparison across markets.
Choices are built from whatever the data currently
covers, so the list changes with the markets on the board.
History
How far back the table runs. Longer histories make an extreme easier to judge, because an extreme only means anything against its own past.
13 weeks
26 weeksdefault
52 weeks
All recorded
Visualisation
Which columns are shown. The summary hides the contract counts for a quicker read; the flips view keeps only the weeks where net positioning changed sign.
Full tabledefault
Summary
Week-over-week change
Flips highlighted
Flip weeks only
Flip direction shown when view is flips or flips_only
A flip is a change in the sign of net positioning between two consecutive reported weeks.
All flipsdefault
Bullish only (short to long)
Bearish only (long to short)
COT week-on-week change
cot_wow_change
Free
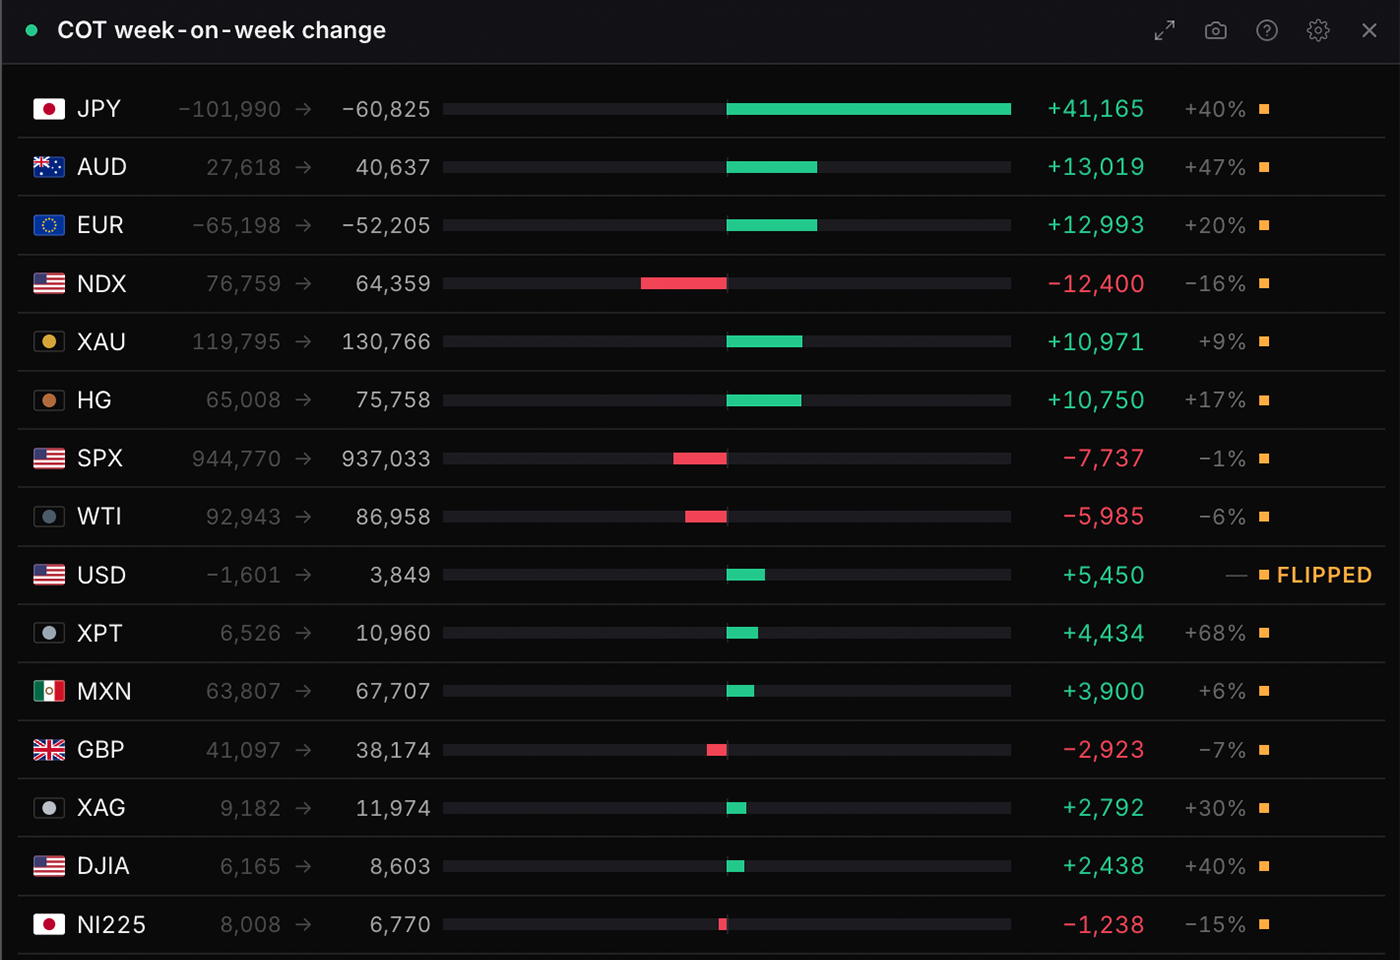
The change in net CFTC positioning against the prior week, ranked by the size of the shift. Shows where speculators added or cut most recently, which is a record of what they have already done rather than a signal of what price will do next.
Settings
Minimum change
Bought means net positioning rose between the two reports, whether that is more longs or fewer shorts.
Choices are built from whatever the data currently
covers, so the list changes with the markets on the board.
Minimum change
Every changedefault
1,000 contracts or more
5,000 contracts or more
Direction
Bought means net positioning rose between the two reports, whether that is more longs or fewer shorts.
Both waysdefault
Bought only
Sold only
Retail currency breakdown
retail_currency_breakdown
Free
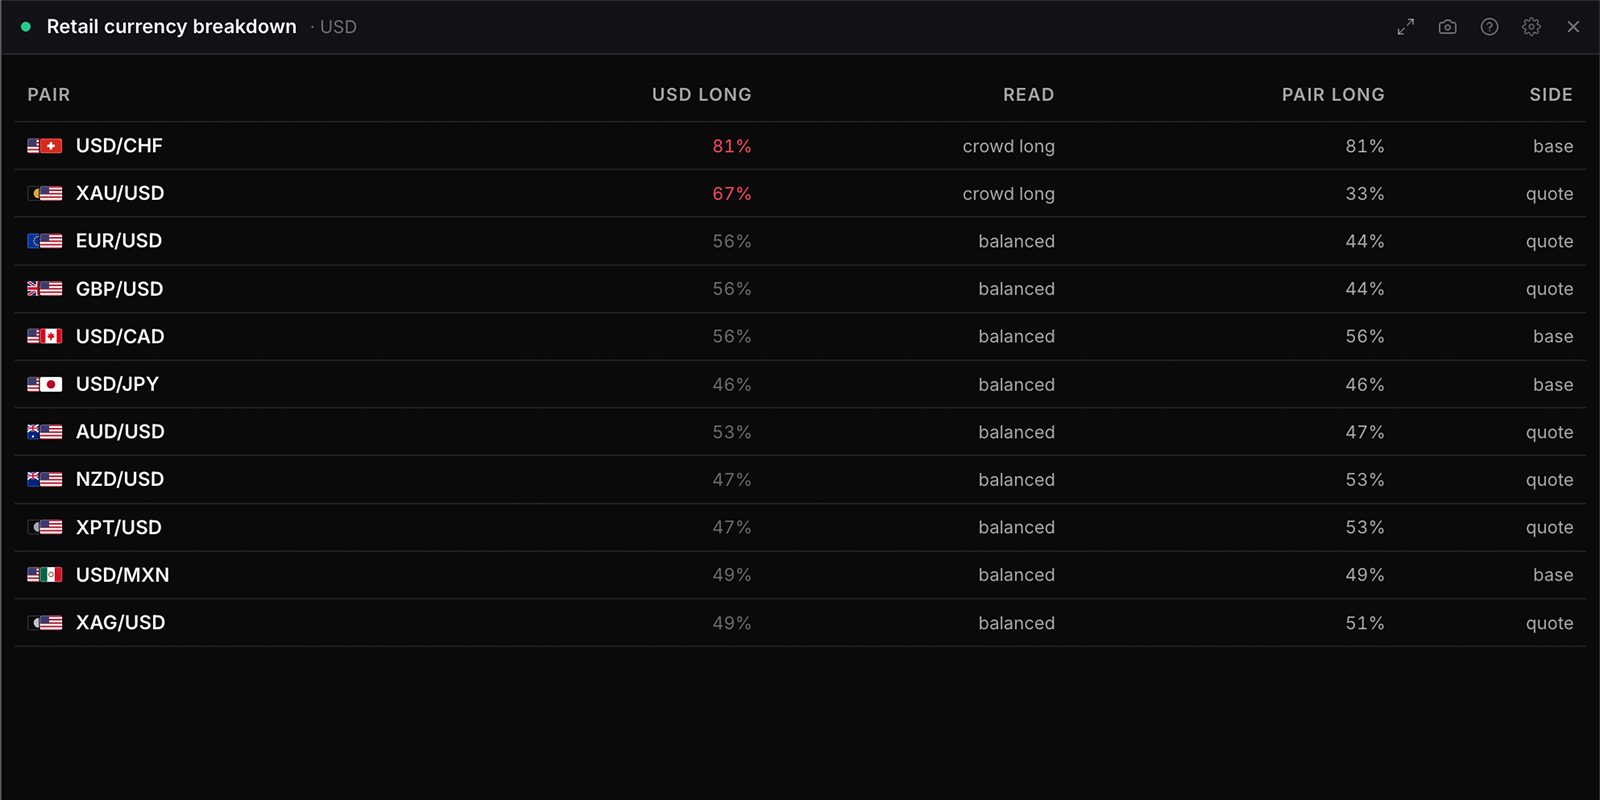
For one currency, shows where its aggregate retail lean comes from, broken down across every retail pair that touches it.
Settings
Currency
Choices are built from whatever the data currently
covers, so the list changes with the markets on the board.
Visualisation
A currency is long through a pair only when it is the base of that pair, so the quote side is inverted before it counts.
Lean by pairdefault
Table
Long vs short pairs
Retail extremes
retail_extremes
Free
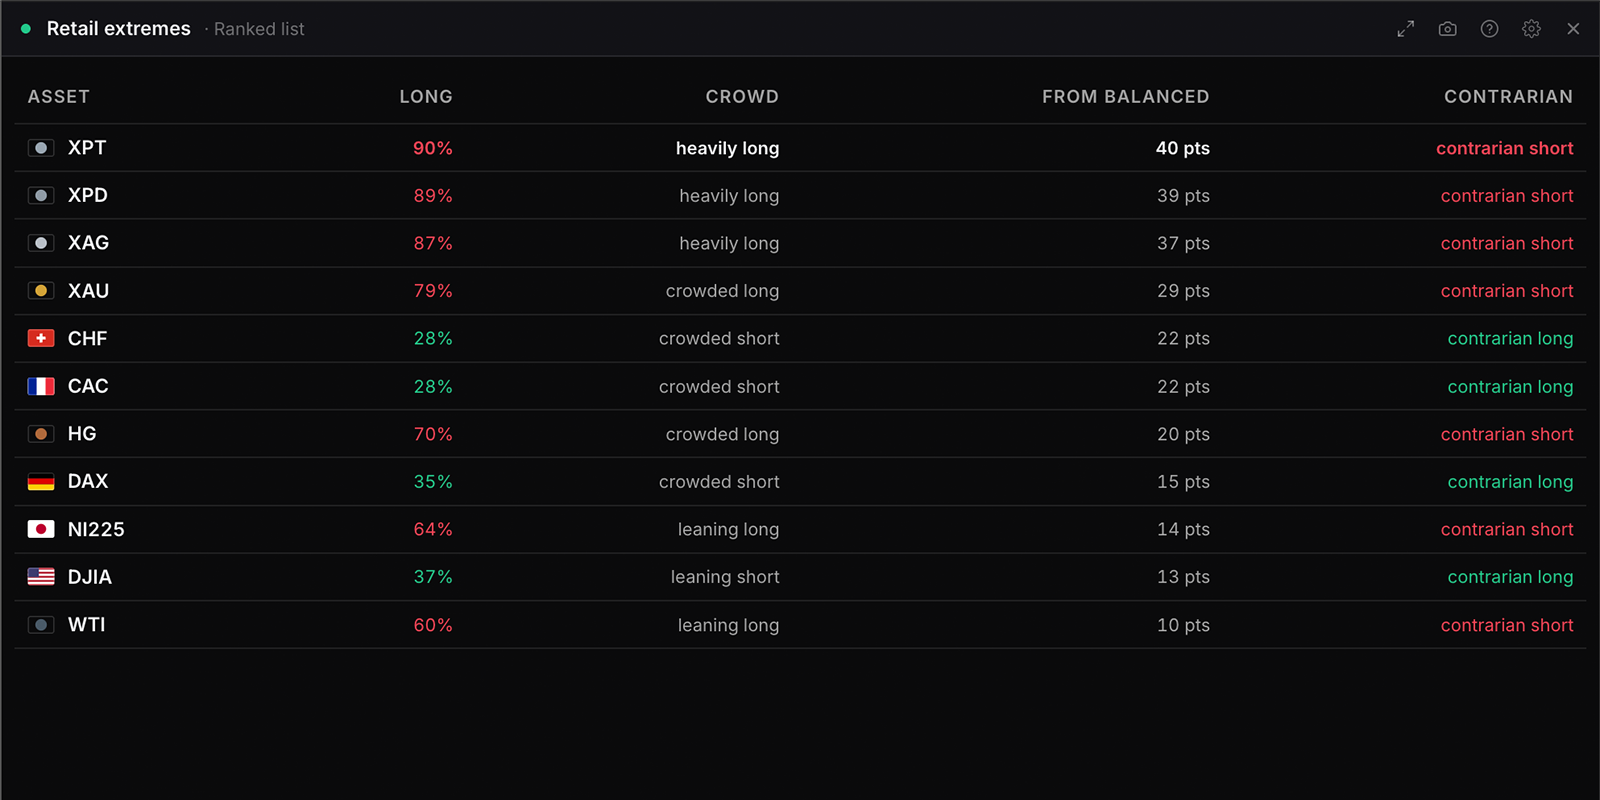
Assets where the retail crowd is most one-sided, ranked as contrarian fade candidates. Ranked list, centred bars or crowd-pressure meters. A crowded book marks where stops are clustered, not when they will be hit.
Settings
Threshold
Looser catches more setups; stricter keeps only the most one-sided crowds.
Loose (60 / 40)
Standard (65 / 35)default
Tighter (70 / 30)
Strict (80 / 20)
Visualisation
Ranked listdefault
Centred bars
Crowd pressure meters
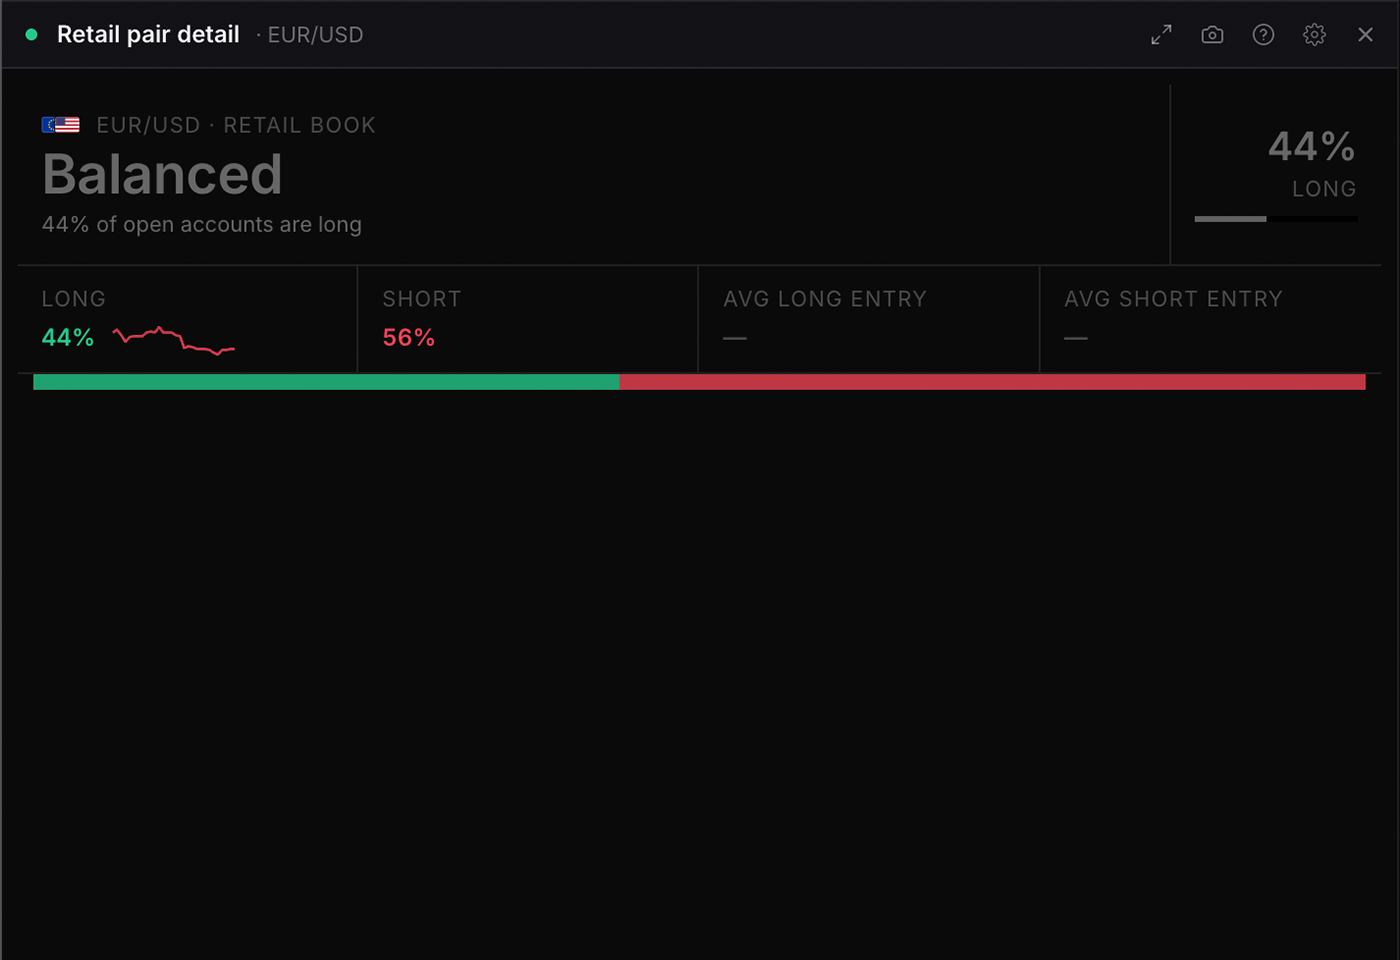
Retail pair detail
retail_pair
Free
The full retail crowd read for a single pair: the long and short split, the crowd's average entry price on each side, and how far price now sits from them. Full detail or split only. Read contrarian, the crowded side shows where stops sit.
Settings
Asset
Choices are built from whatever the data currently
covers, so the list changes with the markets on the board.
Visualisation
Full detaildefault
Split only
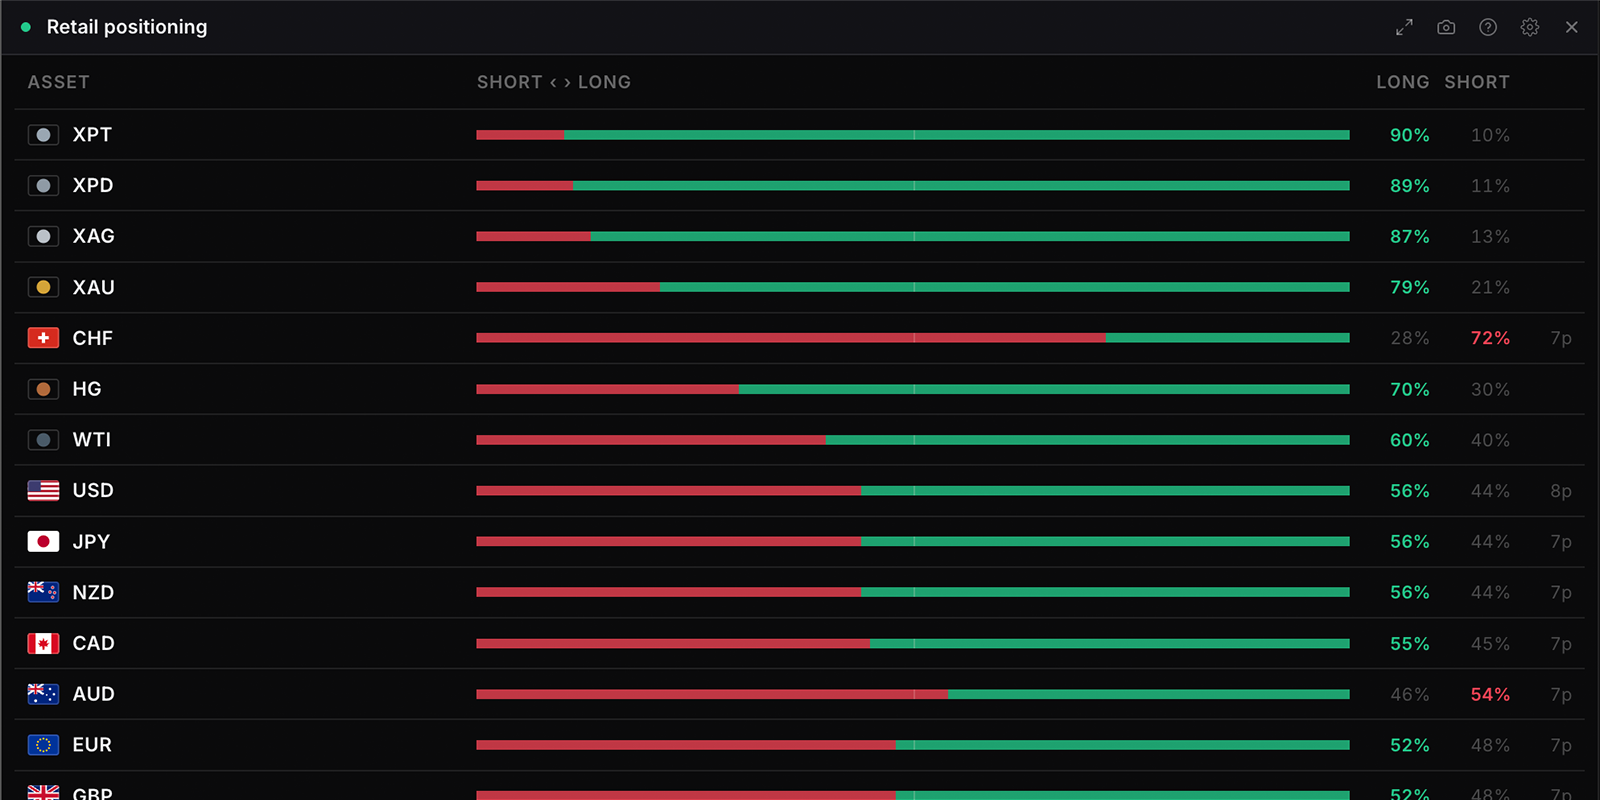
Retail positioning
retail_snapshot
Free
Retail crowd long and short positioning across selected assets, as rows, donuts, ranked bars, columns, a heatmap or a table. Retail is a contrarian signal: a crowded-long book is a bearish tilt, not a timing trigger. For the same data over time, use Retail positioning history.
Settings
Visualisation
Contrarian read names the fade rather than showing the crowd lean.
Choices are built from whatever the data currently
covers, so the list changes with the markets on the board.
Visualisation
Contrarian read names the fade rather than showing the crowd lean.
Long / short rowsdefault
Contrarian read
Donuts
Ranked bars
Columns
Heatmap
Table
Filter
One-sided means the crowd is at least 70% on one side, which are the strongest fade candidates.
All assetsdefault
One-sided only
Sort by
Most one-sideddefault
Most long
Most short
Code A\u2013Z
Sample size
How many pairs the aggregate lean is derived from.
Showdefault
Hide
Flags
Showdefault
Hide
Density
Comfortabledefault
Compact
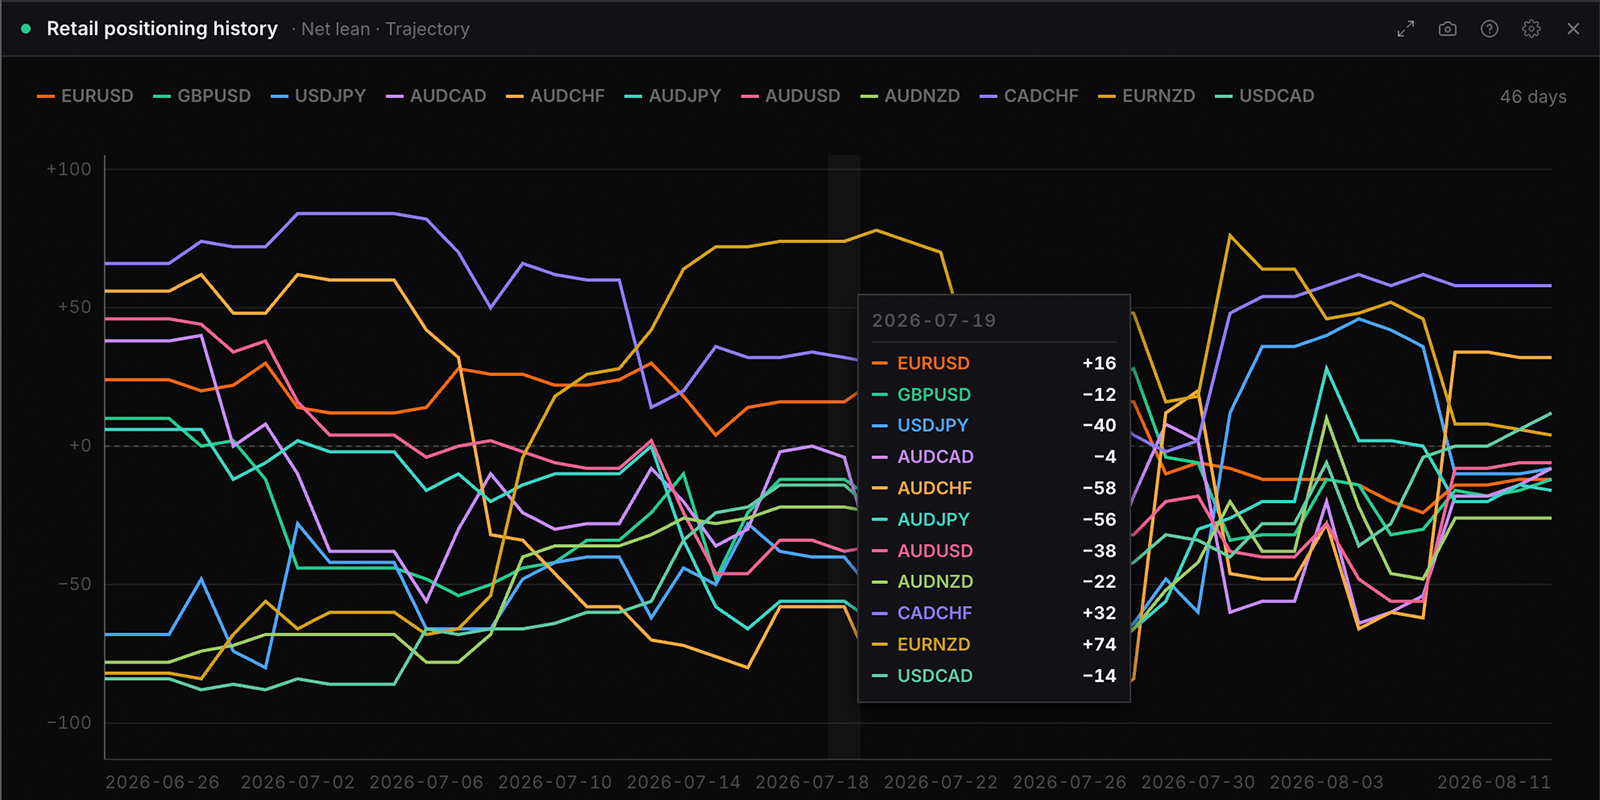
Retail positioning history
retail_history
Free
Daily retail crowd positioning tracked over time. Plot the net lean (long% minus short%), crowd long%, or open interest, as a trajectory, a long and short split, the change over the window, or a table. Windows from 30 days to everything held.
Settings
Crosses
Overlay as many pairs as you like; the legend toggles each one.
Choices are built from whatever the data currently
covers, so the list changes with the markets on the board.
Measure
Net puts an even book at zero and reads as a lean with a direction.
Net leandefault
Crowd long %
Open interest (lots)
Visualisation
The split reads one pair at a time: it is a share of the whole, and two crowds stacked on one axis would not sum to anything.
Trajectorydefault
Long / short split
Change over window
Table
Window
Last 30 days
Last 60 daysdefault
Last 120 days
All held
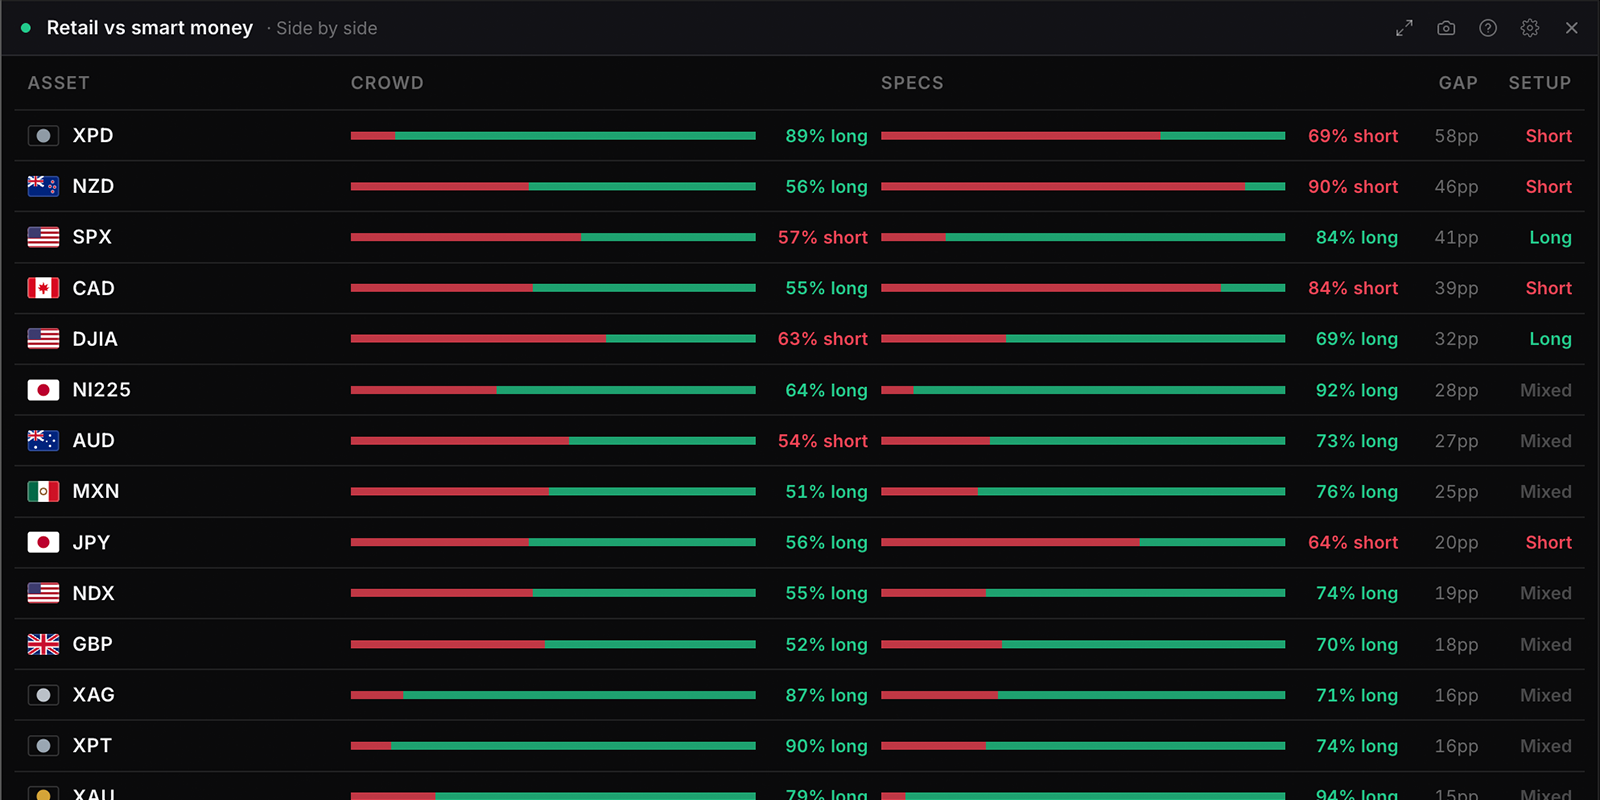
Retail vs smart money
retail_vs_cot
Free
The retail crowd set against CFTC speculators for each asset: one is read contrarian, the other as positioning by those who hedge and speculate at size. Agreement between them is a crowded trade on both sides; disagreement is where the contrarian case is cleanest. Only assets carried by both datasets appear.
What the data is
The retail book and the speculative book for the same market, side by side. Retail positioning comes from aggregated broker data and updates through the day; the speculative side is the weekly CFTC report, so it is several days old by comparison.
Hold that mismatch in mind. You are comparing something measured this morning against something measured last Tuesday, which is fine for a standing divergence and misleading for a sharp one.
Retail sentiment is also broker-specific. Any feed is a sample of one broker’s clients rather than the whole retail world, so it is a directional read and not a precise measurement.
How to read it
The signal is the disagreement, not either side alone. Retail heavily long while the funds are net short is the configuration worth attention: the informed, trend-following money and the contrarian retail money pointing opposite ways.
When both crowds agree the read is weaker, not stronger. Agreement means everybody is already on the same side, which is a crowded trade rather than a confirmed one.
The misreading to avoid: retail is not always wrong. The contrarian edge lives at the extremes. When retail is roughly balanced this widget is telling you very little, and reading a signal into it anyway is how people talk themselves into trades.
Settings
Visualisation
The quadrant plots the crowd against the specs, so the two disagreement corners are the setups.
Choices are built from whatever the data currently
covers, so the list changes with the markets on the board.
Visualisation
The quadrant plots the crowd against the specs, so the two disagreement corners are the setups.
Side by sidedefault
Crowd vs specs
Positioning quadrant
Heatmap
Table
Conviction band
How far each side must lean before a setup is called. Stricter bands mean fewer, cleaner signals.
Loose (55/45)default
Standard (60/40)
Strict (70/30)
Filter
Setups are the assets where the crowd and the specs sit on opposite sides.
All assetsdefault
Setups only
Sort by
Widest disagreementdefault
Setups first
Code A\u2013Z
Flags
Showdefault
Hide
Density
Comfortabledefault
Compact
Trade ideas
6 widgets
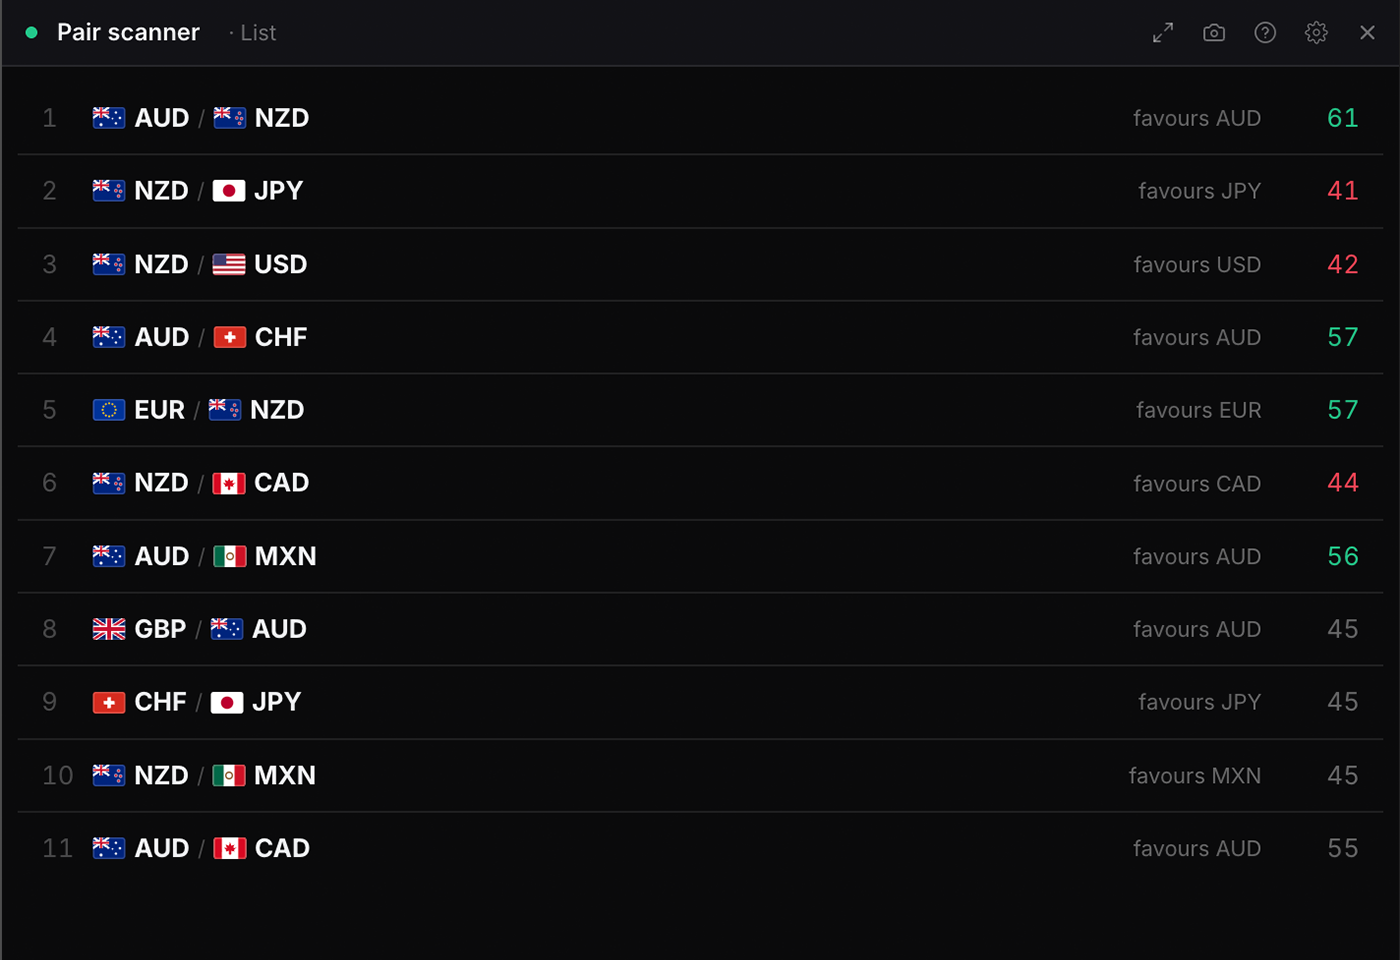
Pair scanner
pair_scanner
Free
All pairs meeting a minimum score divergence threshold: live, auto-ranked by edge strength.
Settings
Minimum divergence
Distance of the pair composite from 50, in either direction.
Choices are built from whatever the data currently
covers, so the list changes with the markets on the board.
Minimum divergence
Distance of the pair composite from 50, in either direction.
Every pair
5 from neutral
10 from neutraldefault
15 from neutral
20 from neutral
Direction
Bothdefault
Favours the base
Favours the quote
Visualisation
Listdefault
Table
Score bars
Show
Top 10
Top 20default
Every match
Flags
Showdefault
Hide
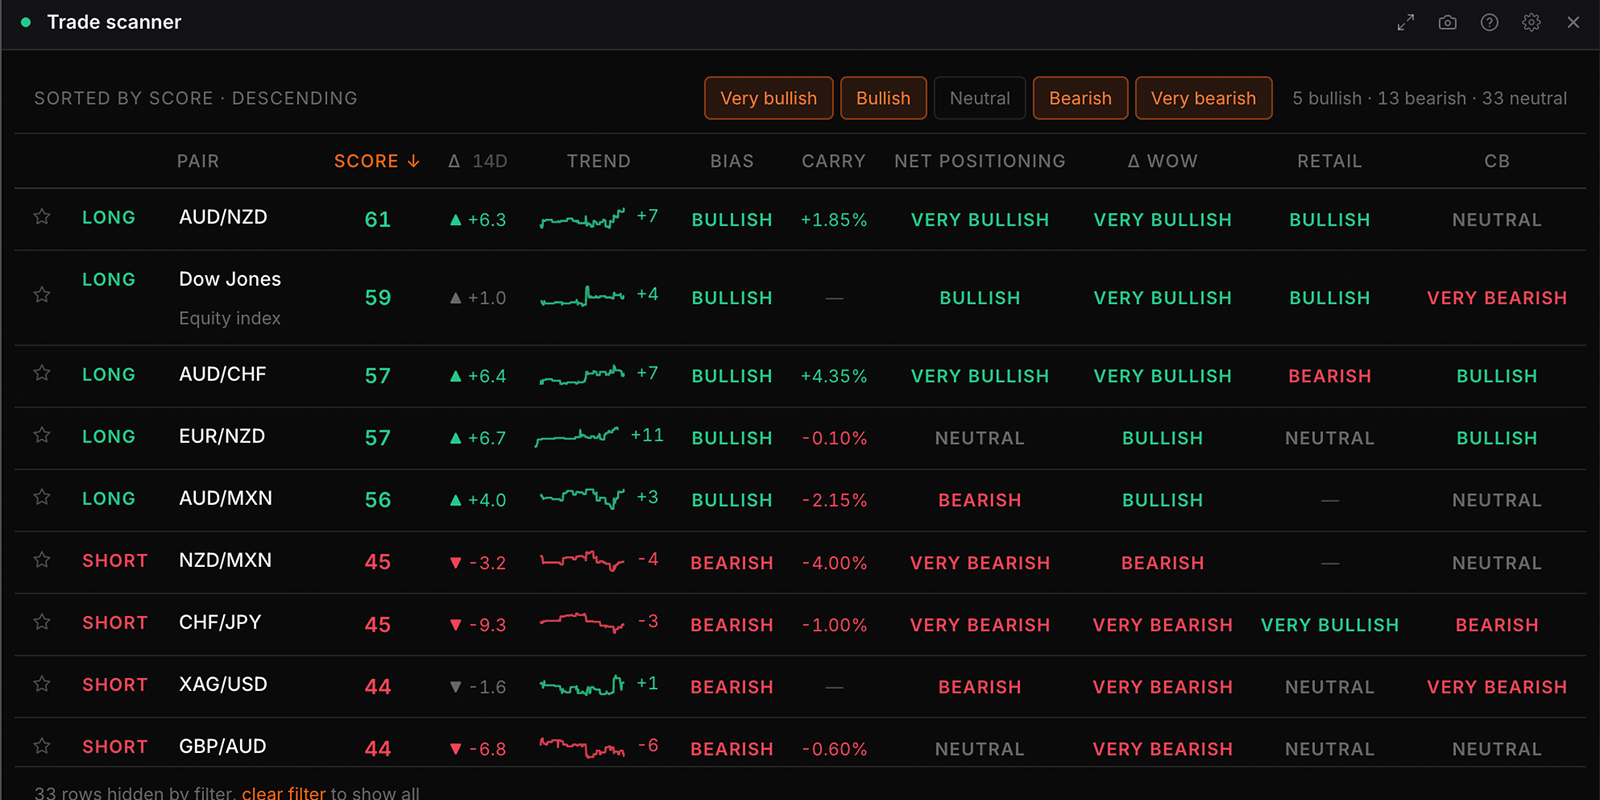
Trade scanner
trade_scanner
Free
Every tradable read the engine holds in one ranked table: the crosses and every metal, commodity and index scored on its own. Leads with the side rather than the number, so a composite of 31 reads as a strong short and not a weak pair. Sort by any column, filter to the tiers you want, and see the move since the last persisted score with the age of that reading attached.
Settings
Universe
Single assets are the metals, commodities and indices the engine scores on their own.
Choices are built from whatever the data currently
covers, so the list changes with the markets on the board.
Universe
Single assets are the metals, commodities and indices the engine scores on their own.
Crosses and single assetsdefault
Crosses only
Single assets only
Minimum conviction
Distance of the composite from 50, in either direction.
Every rowdefault
5 from neutral
10 from neutral
15 from neutral
Rows
Alldefault
Top 10
Top 20
Top 30
Flags
Showdefault
Hide
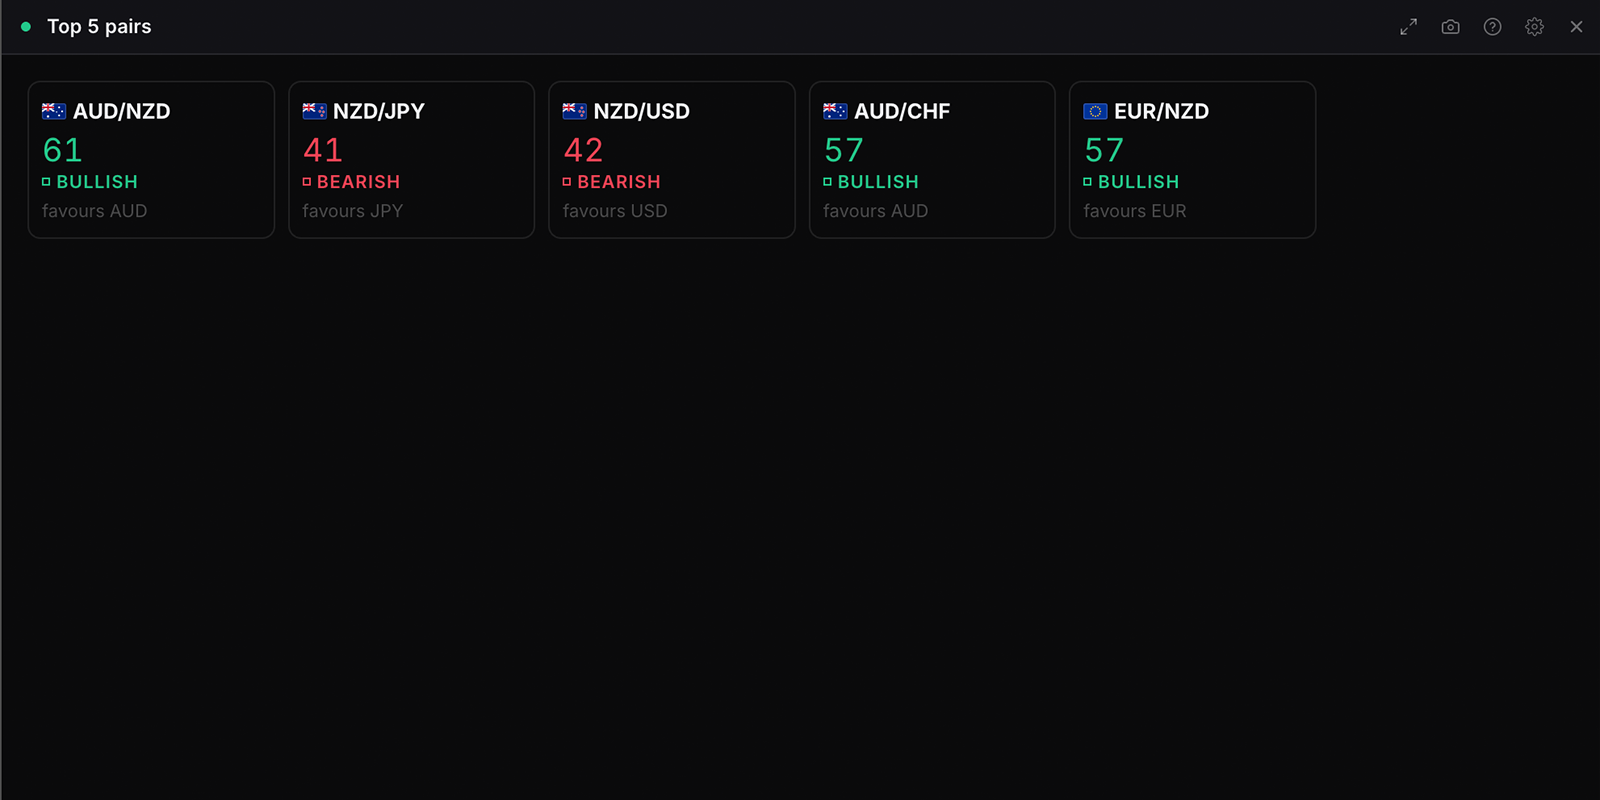
Top 5 pairs
top_5_pairs
Free
The five pairs with the largest directional edge. Same ranking as Top conviction pair, which shows the leader alone.
Settings
Visualisation
Pick everything, a whole class, or any combination of individual assets.
Choices are built from whatever the data currently
covers, so the list changes with the markets on the board.
Visualisation
Listdefault
Cards
Score bars
Flags
Showdefault
Hide
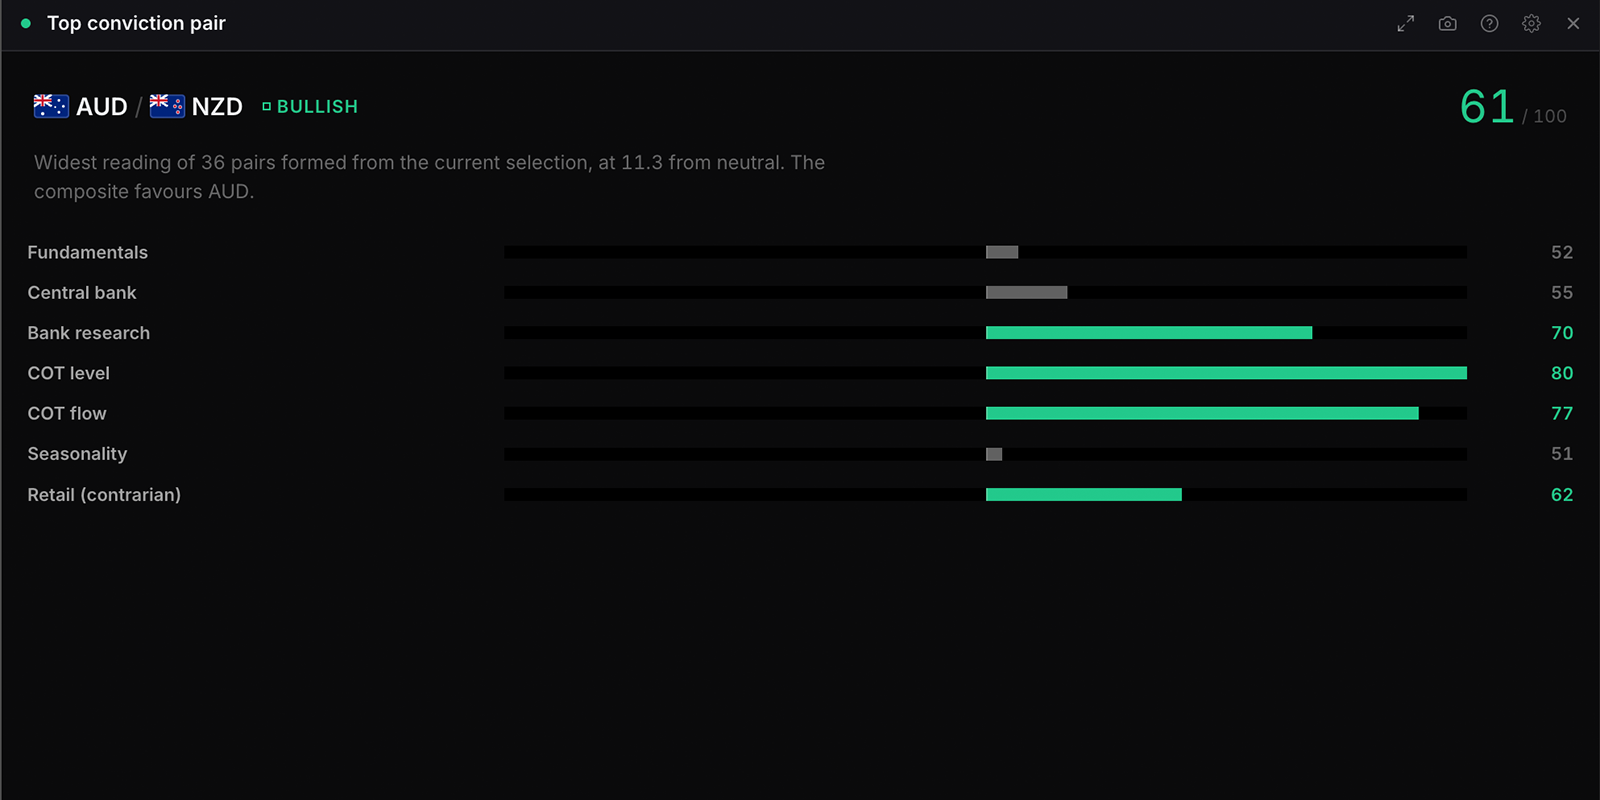
Top conviction pair
top_pair_idea
Free
The single pair with the largest directional edge. Full card, compact single row, or expanded breakdown bars. Same ranking as Top 5 pairs, which shows the leading five.
Settings
Visualisation
Pick everything, a whole class, or any combination of individual assets.
Choices are built from whatever the data currently
covers, so the list changes with the markets on the board.
Visualisation
Full carddefault
Single row
Breakdown bars
Flags
Showdefault
Hide
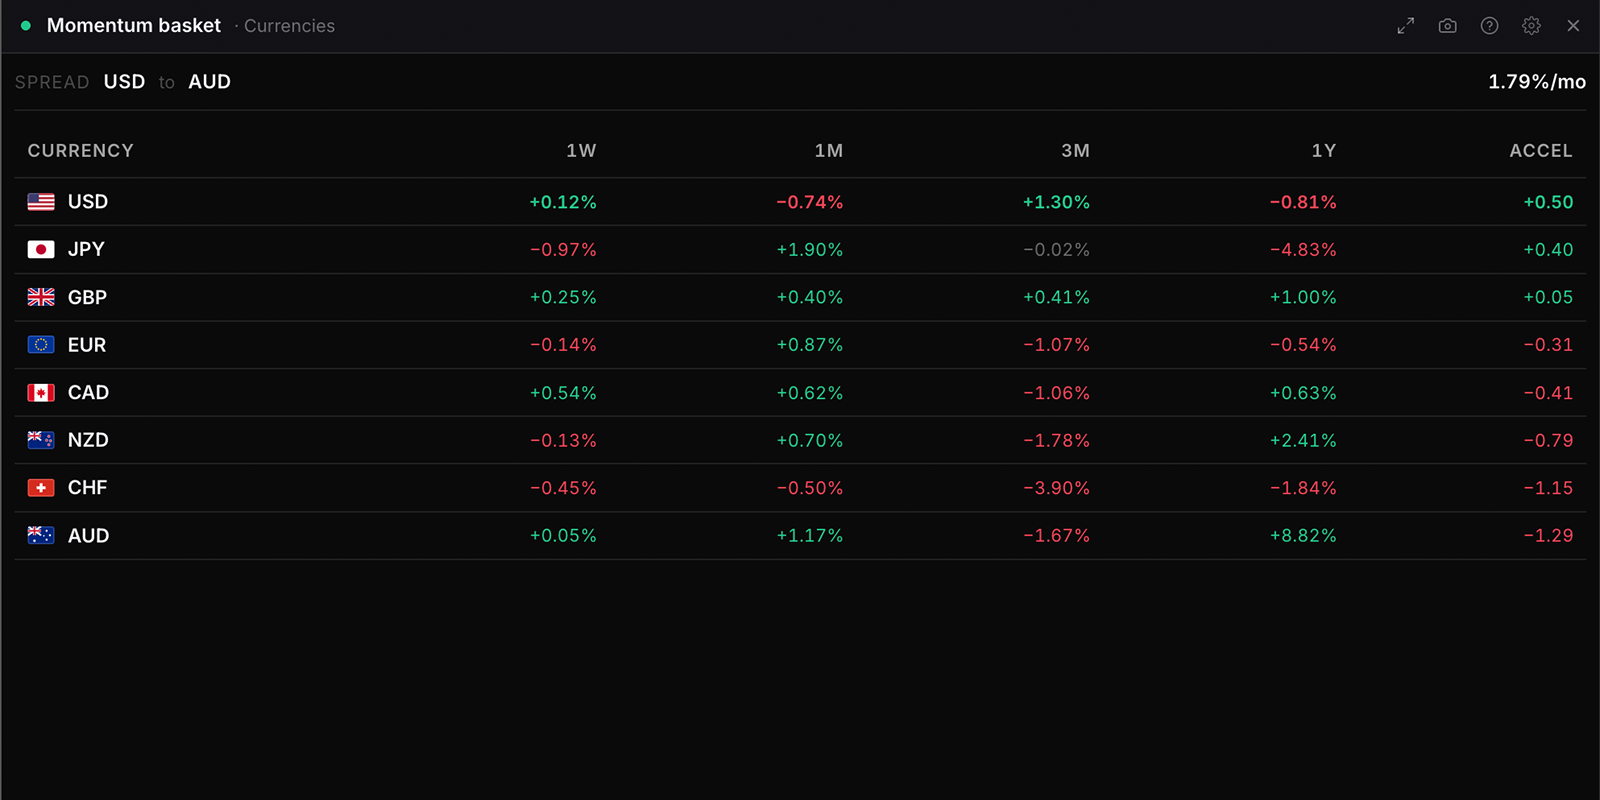
Momentum basket
momentum_basket
Free
The whole board ranked by how far it has moved over a week, a month, a quarter and a year, with the acceleration between the recent pace and the long-run one. Ranks currencies by default, because as pairs a single broad dollar move fills the top of the table eight times over. A record of what has happened, not a signal: it ranks and measures, it does not take a side.
Settings
Rank
Ranked as pairs, one broad dollar move fills the top of the table eight times. Currency legs count it once.
Currenciesdefault
Pairs and assets
Sort by
Acceleration is the 3-month pace against the 1-year pace, per month. A window on its own says how far, not whether it is still moving.
Accelerationdefault
1 week
1 month
3 months
1 year
Order
Strongest firstdefault
Weakest first
Rows
8
15
Everything rankeddefault
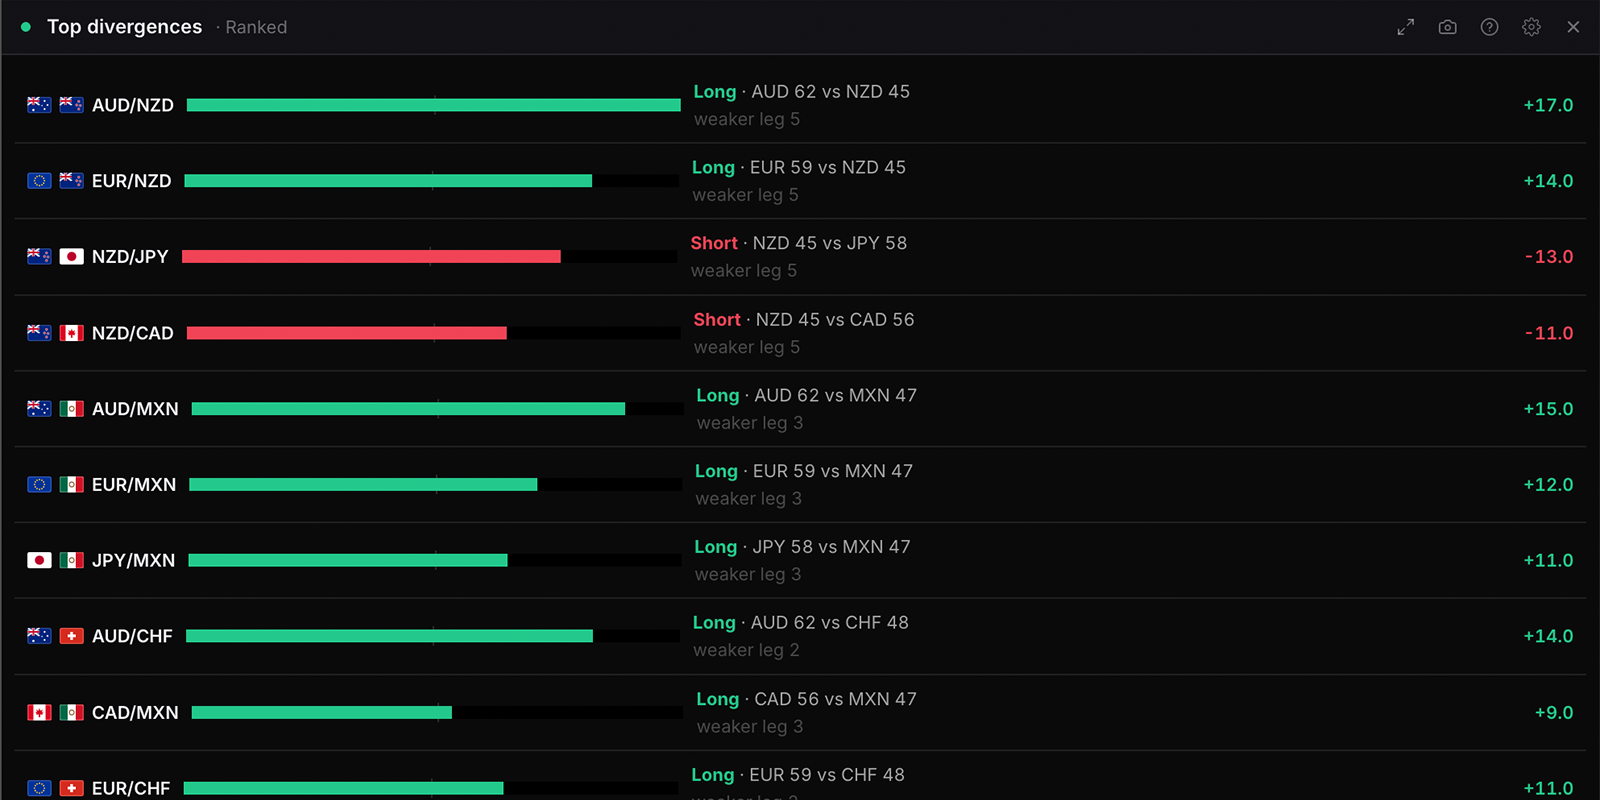
Top divergences
score_divergences
Free
The cleanest two-sided divergence trades on the board. Ranks pairs by the score gap multiplied by the conviction of the weaker leg, so a 60-bull against a 30-bear outranks an 80-bull against a 50-neutral at the same gap.
Settings
Currencies
One-legged means the second currency sits at neutral or leans the same way, so only one side of the trade is doing work.
Choices are built from whatever the data currently
covers, so the list changes with the markets on the board.
Visualisation
Rankeddefault
Gap vs support
Table
Show
Top 5
Top 10default
Top 20
All pairs
Include
One-legged means the second currency sits at neutral or leans the same way, so only one side of the trade is doing work.
Two-sided onlydefault
One-legged too
Flags
Showdefault
Hide
Market data
12 widgets
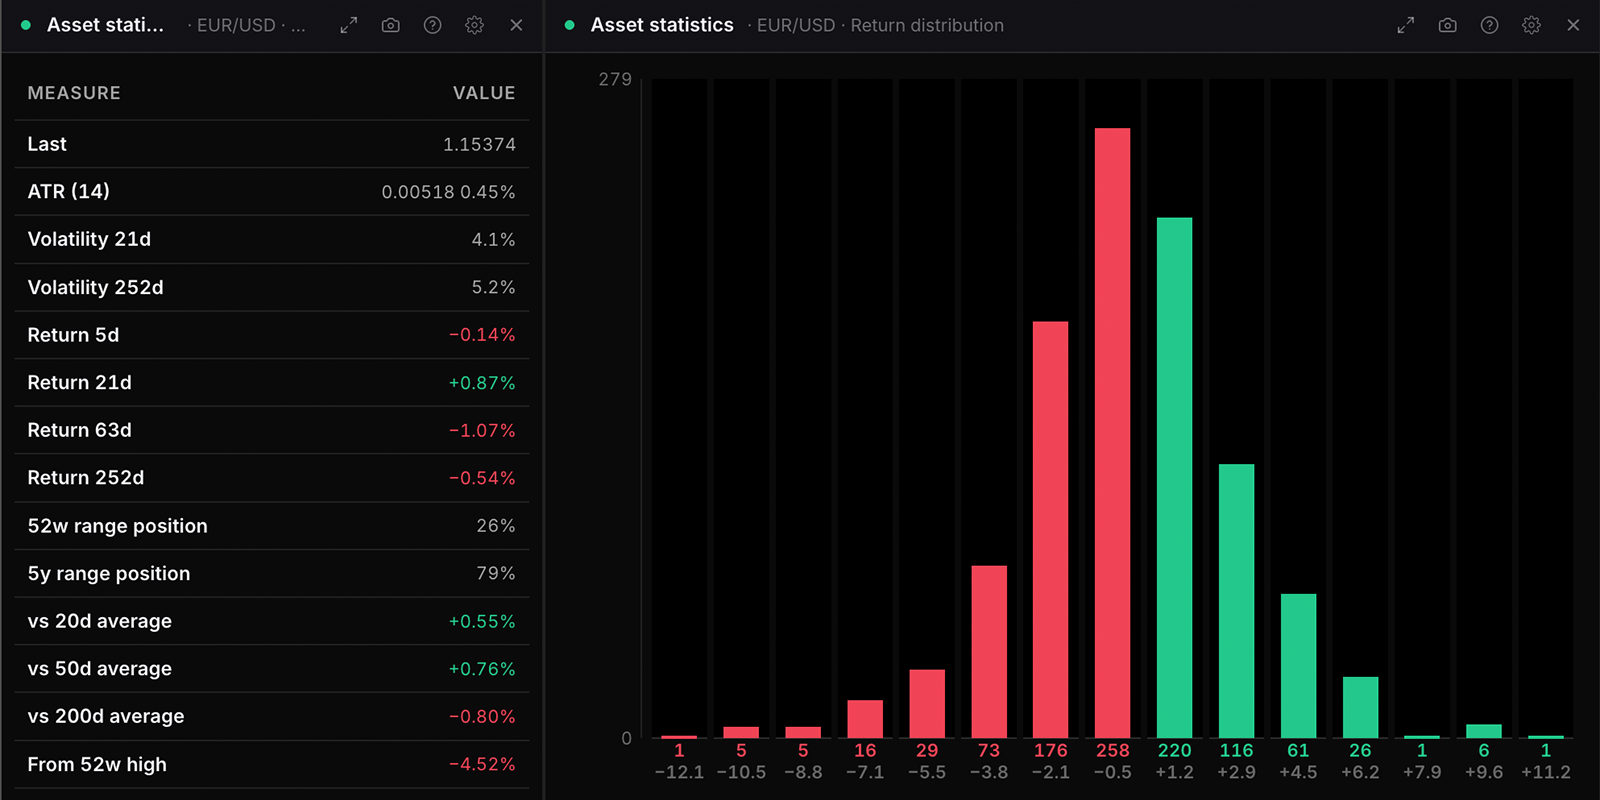
Asset statistics
pair_statistics
Free
Statistical profile for any asset: historical volatility, return percentiles, price position against the 52-week and 5-year range, moving-average deviation, drawdown, and a 30-day return distribution. Descriptive statistics, not a forecast.
Settings
Asset
Choices are built from whatever the data currently
covers, so the list changes with the markets on the board.
Visualisation
Statistics paneldefault
Volatility term structure
Return distribution
Day of week bias
Monthly seasonal bias
Bias measure shown when view is dow or monthly
Average returndefault
Positive rate
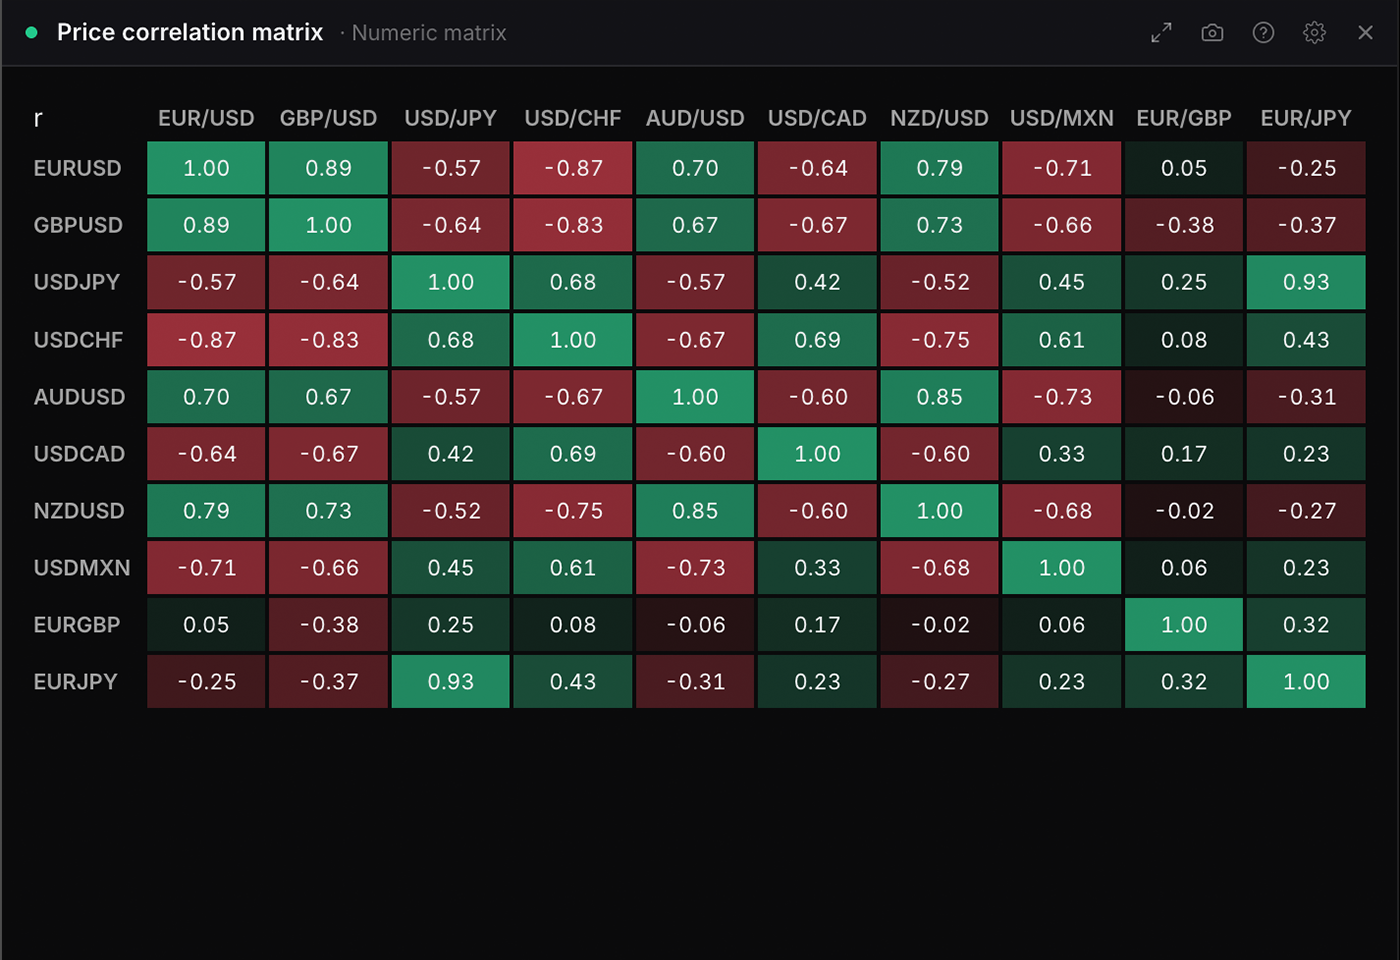
Price correlation matrix
price_correlation
Free
Rolling correlation of daily price returns across instruments. High positive = moving together (stacked risk); negative = natural hedges. Computed live from price history.
Settings
Instruments
Correlation is measured on log returns, not on price levels. Levels trend, so correlating them reads near +1 for almost any two instruments.
Choices are built from whatever the data currently
covers, so the list changes with the markets on the board.
Candles
4 hourdefault
Daily
Weekly
Window
30 bars
60 barsdefault
120 bars
250 bars
Visualisation
Correlation is measured on log returns, not on price levels. Levels trend, so correlating them reads near +1 for almost any two instruments.
Numeric matrixdefault
Colour only
Ranked pairs
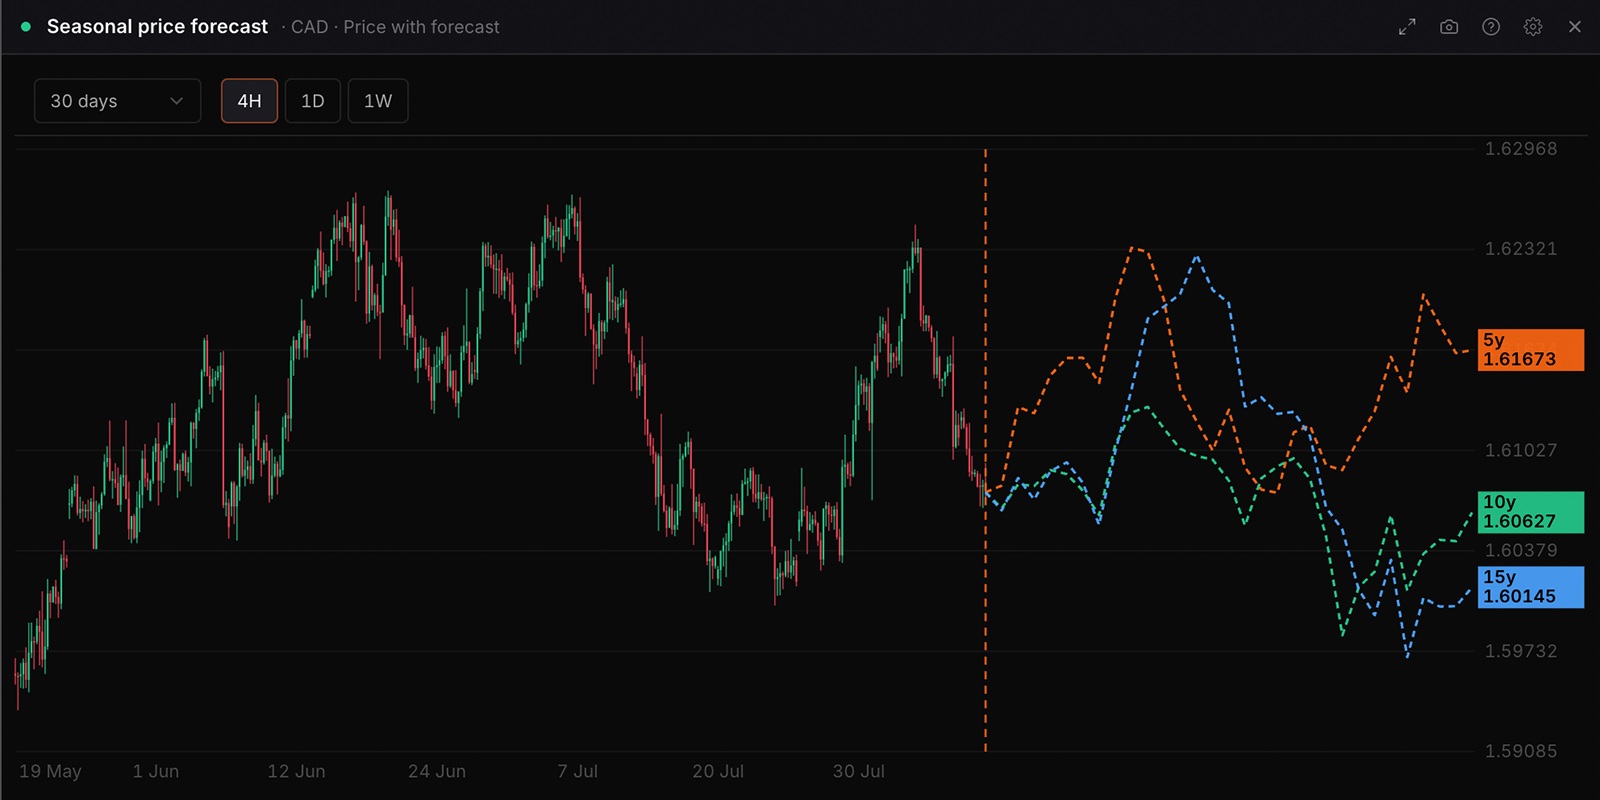
Seasonal price forecast
seasonal_forecast
Free
The seasonal path ahead for any asset, projected forward over your chosen horizon from the average of what it did on these calendar days in previous years, rebased so today reads zero. Shorter and longer look-back windows are plotted together. This is a record of a tendency, not a projection of this year.
Settings
Asset
Choices are built from whatever the data currently
covers, so the list changes with the markets on the board.
Against
Nothing (single asset)default
Candles shown when view is price
Four-hour is the timeframe the price feed is known to serve for every symbol. Daily and weekly come from a separate end-of-day feed which does not cover every instrument.
4 hourdefault
Daily
Weekly
Chart controls
Horizon and candle interval as buttons above the plot.
On the chartdefault
Settings only
Horizon
7 days
14 days
30 daysdefault
60 days
Visualisation
This is the average of what the asset did over these calendar days in past years, rebased so today reads zero. It is a record of a tendency, not a projection of this year.
Price with forecastdefault
Path ahead (%)
Move at horizon
Table
Seasonality
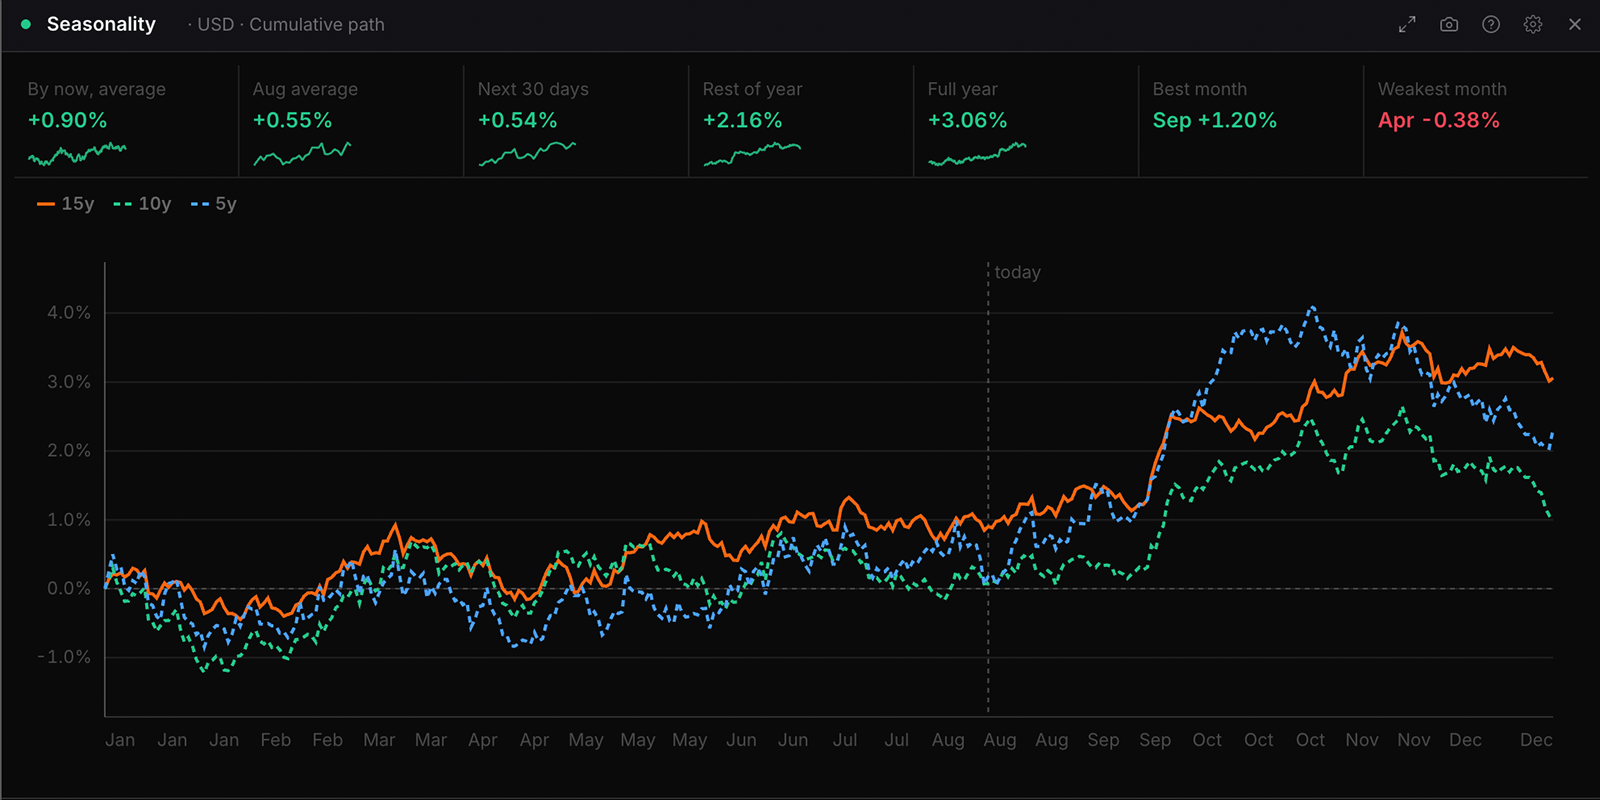
seasonality
Free
Historical seasonal % path for any asset: currency, commodity, equity index, or major pair (pair paths are base − quote). Line chart (5/10/15y), monthly bars, or a forward-move table across all assets.
Settings
Asset
Choices are built from whatever the data currently
covers, so the list changes with the markets on the board.
Against
Builds a pair, e.g. EUR against USD gives EUR/USD.
Nothing (single asset)default
Window
Overlay shorter windows to see whether the pattern holds or is a one-regime artefact. In the table each window gets its own columns.
Choices are built from whatever the data currently
covers, so the list changes with the markets on the board.
Visualisation
Cumulative pathdefault
By month
Table
Stats shown
By now
This month
Next 30 days
Rest of year
Full year
Best month
Weakest month
Window
Columns
Each selected window contributes its own columns, so three windows and both measures is six.
Average and cumulativedefault
Average only
Cumulative only
Line style
Linedefault
Area
Baseline (+/-)
Today marker
Showdefault
Hide
Index constituents
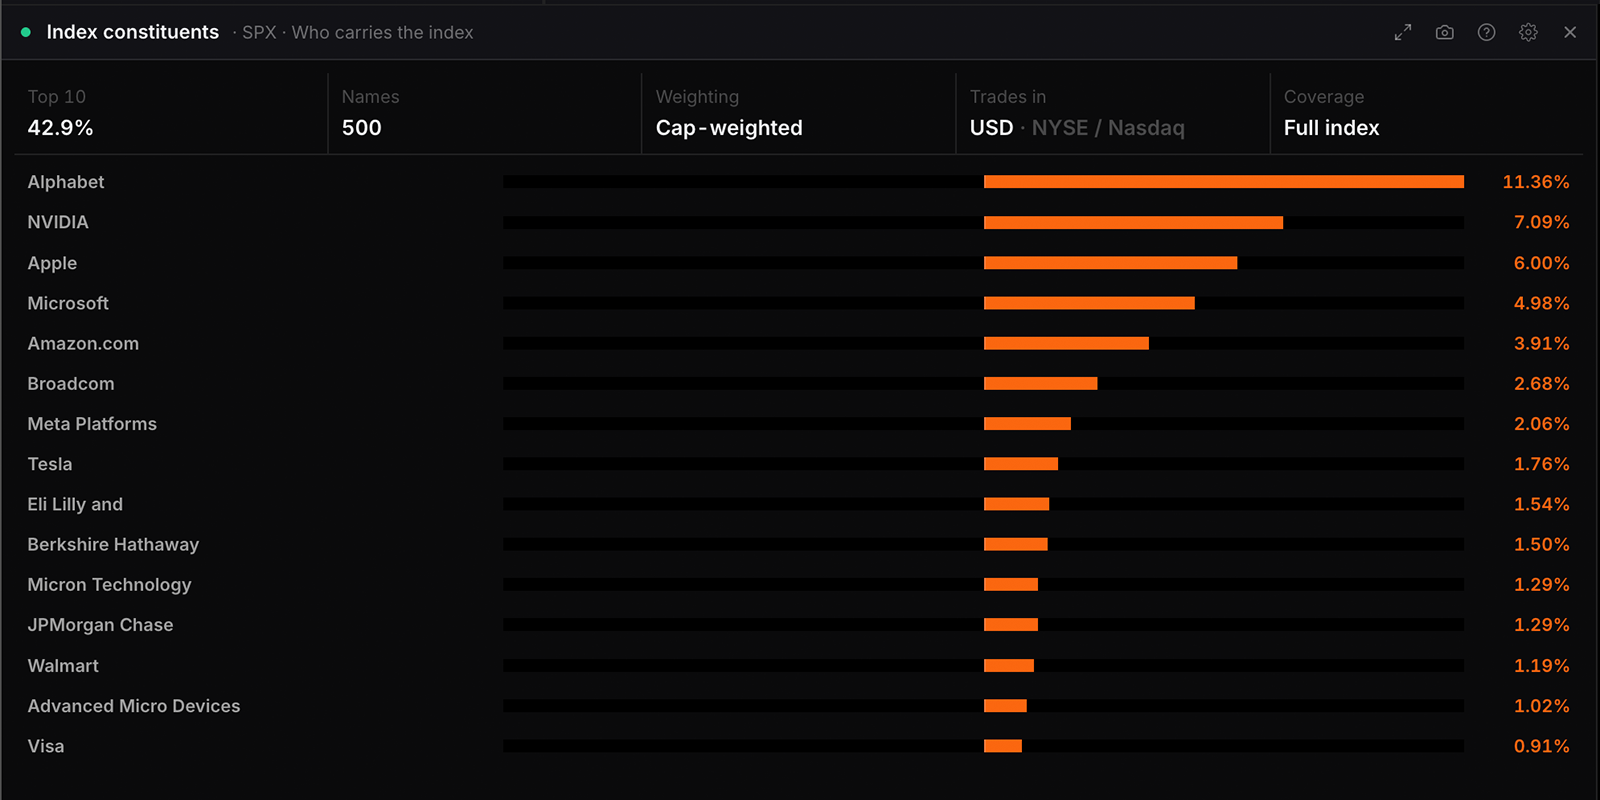
index_constituents
Free
What is inside an index and what each name is worth to it: weights, concentration, and where today’s move came from. Coverage and weighting basis are stated, because a partial list cannot claim a share of the index.
Settings
Index
Choices are built from whatever the data currently
covers, so the list changes with the markets on the board.
Visualisation
Who carries the indexdefault
What moved it today
Broad move or one name
What business it is in
How earnings season is going
Table
Names shown
Top 10
Top 15default
Top 25
Everything
Summary strip
Hide it on a board where another panel already carries it.
Showdefault
Hide
Density
Comfortabledefault
Compact
Currency strength index
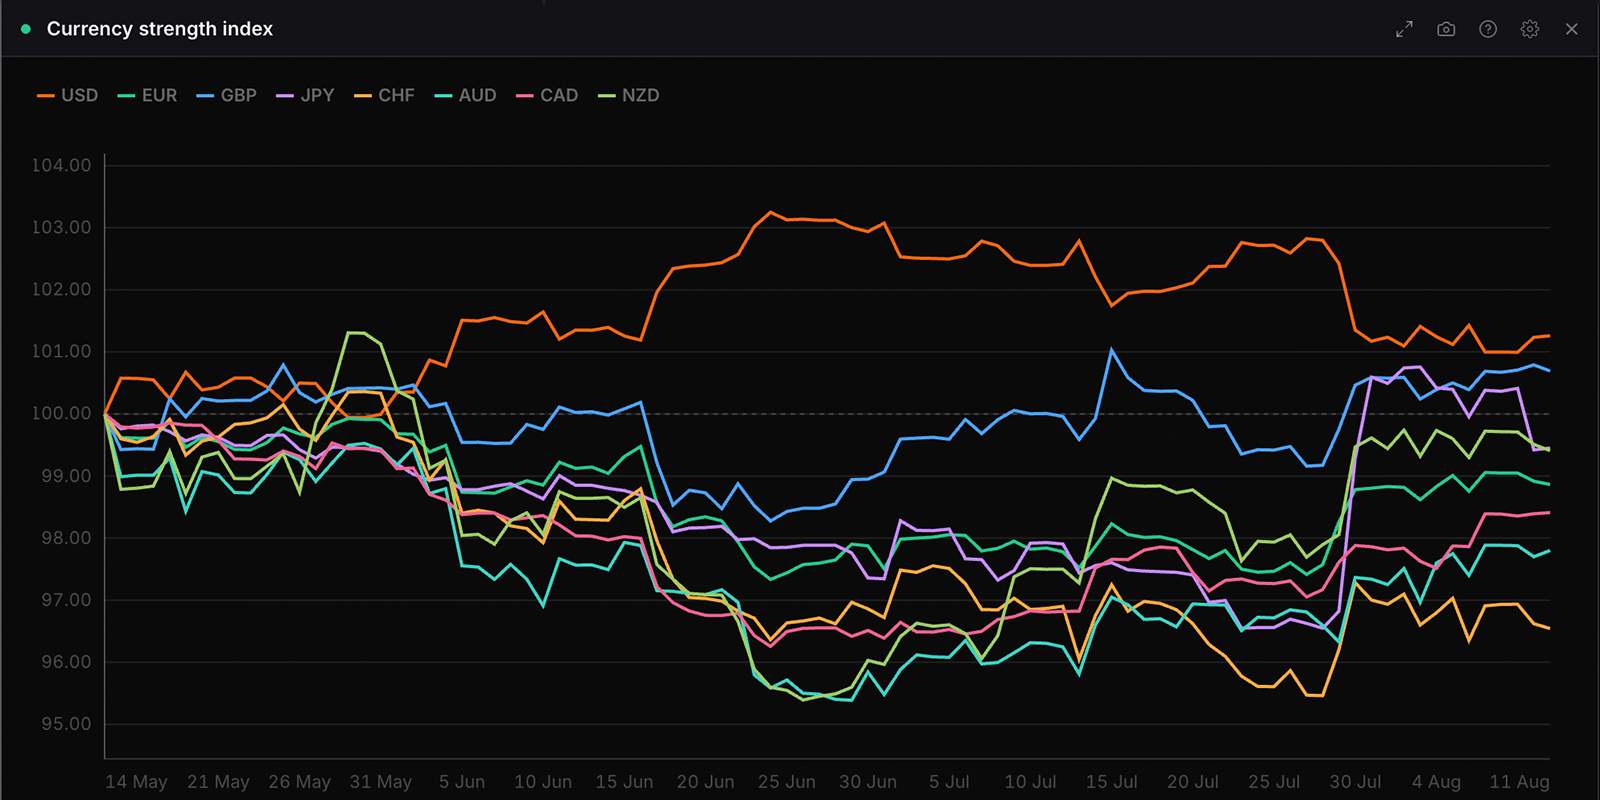
currency_strength
Free
Relative currency strength over time, indexed to 100 at the start of the window. Pick the currencies to compare and the timeframe. Each timeframe refreshes on its own schedule, from every 15 minutes on the hourly timeframe to twice a day on the daily one.
Settings
Visualisation
Lines over the windowdefault
Where each finished
Currencies
Hiding a currency changes what is drawn, never the
Choices are built from whatever the data currently
covers, so the list changes with the markets on the board.
Window
Hourly
4 hour
Dailydefault
Weekly
Monthly
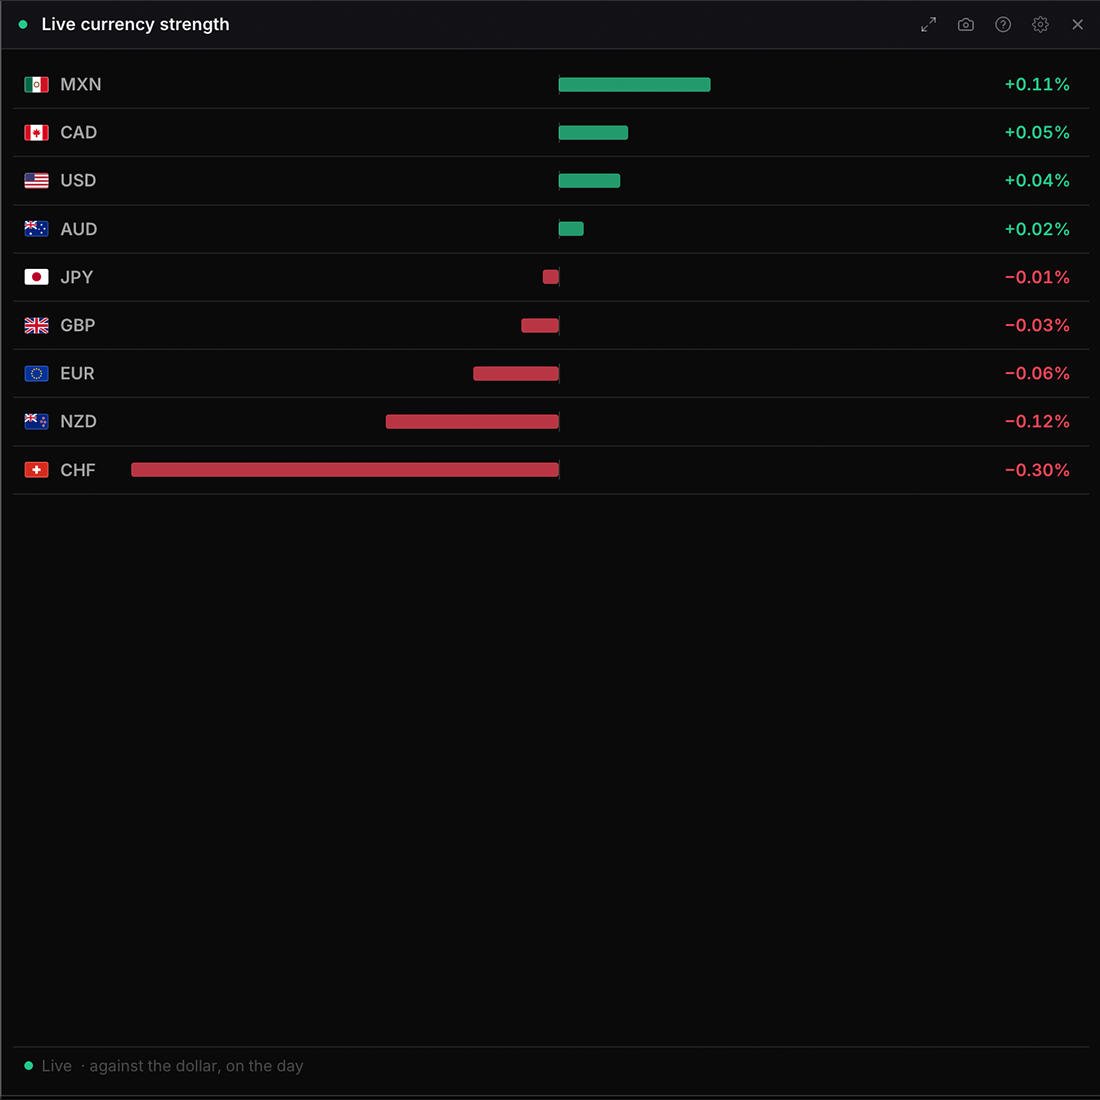
Live currency strength
live_ccy_strength
Free
Which currencies are being bought and sold right now, built from live ticks. Each currency is scored by the average move across every streaming pair it appears in, so it is a read on the whole board rather than a move against the dollar. Re-ranks and flashes as prices move. For the dollar-indexed version over a fixed window, use Currency strength index.
Settings
Scale
Fitting makes a quiet session readable; fixed keeps the
Fit the strongest movedefault
Fixed, plus or minus 1%
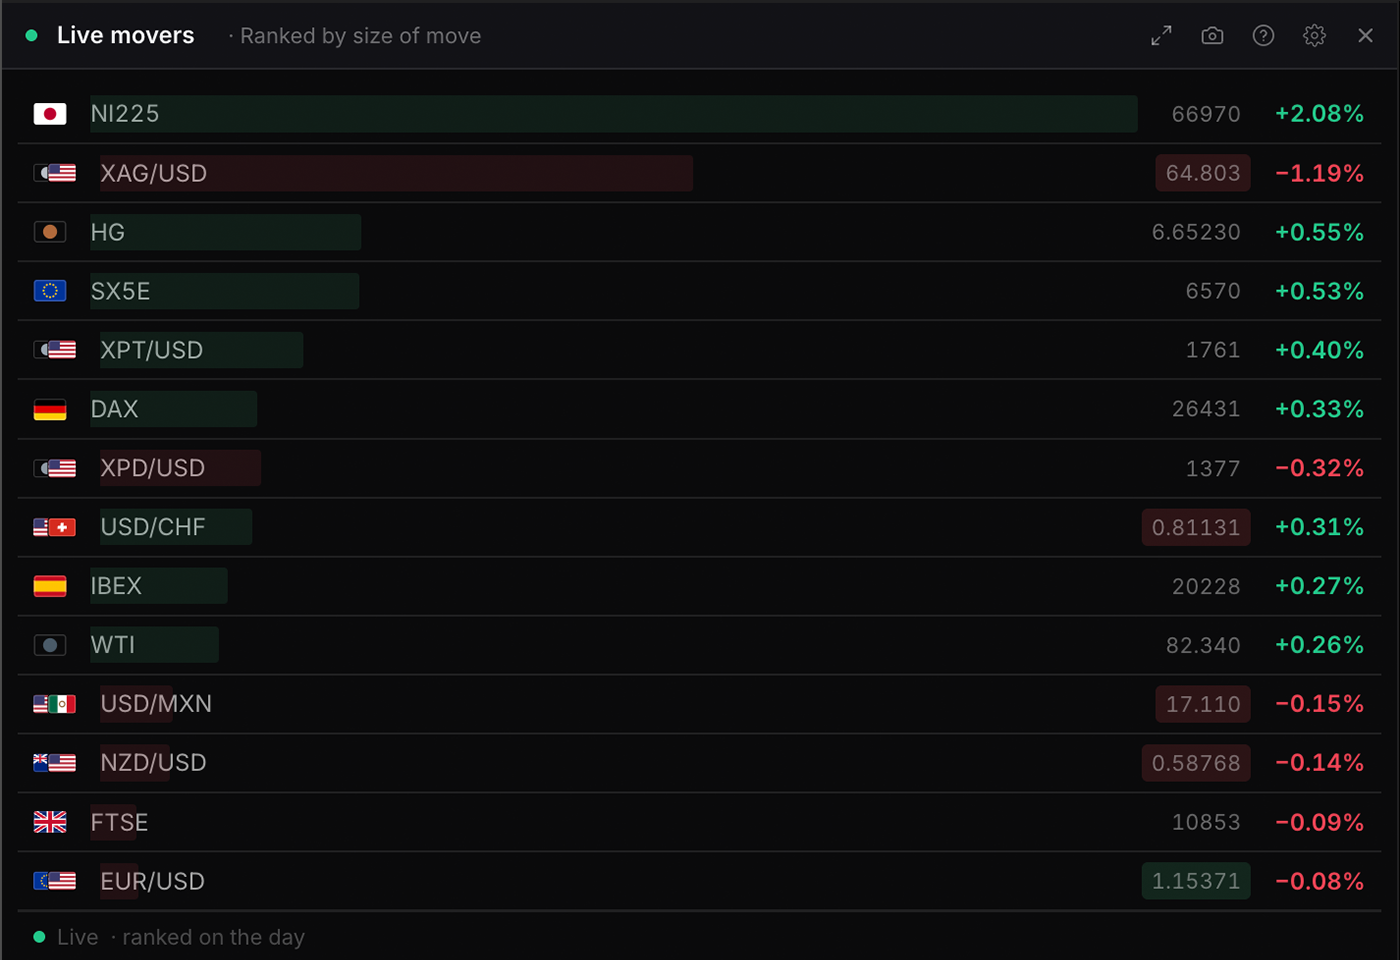
Live movers
live_movers
Free
Biggest gainers and losers across your selected assets, ranked and re-sorted live as prices tick, with green/red flashes.
Settings
Visualisation
Ranked by size of movedefault
Gainers and losers
Show
FX majors
Metals
Indices
How many
Top 5
Top 8default
Everything
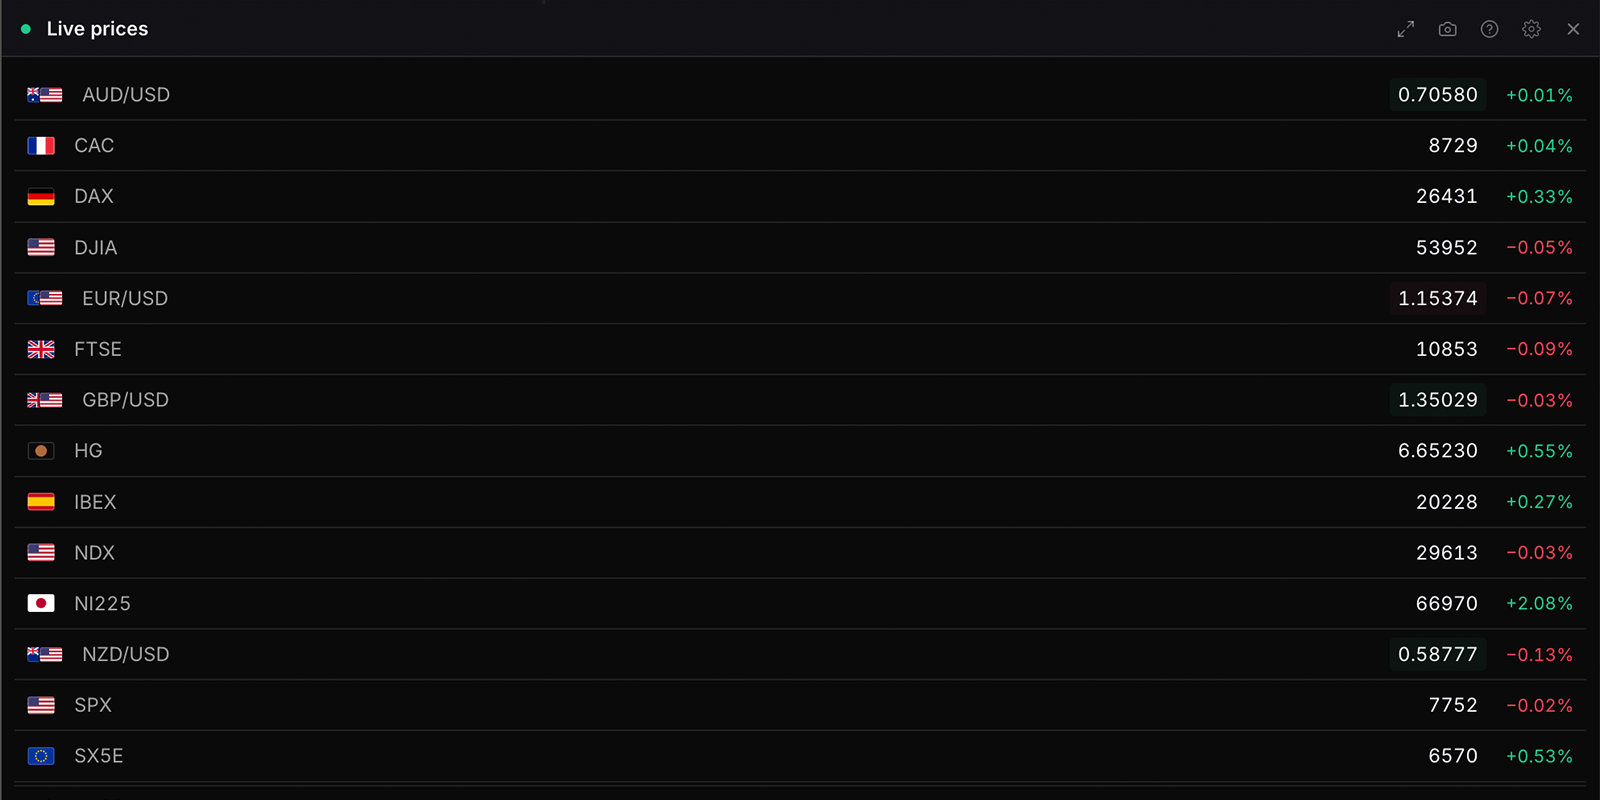
Live prices
live_prices
Free
Real-time prices across FX majors, metals, commodities (WTI, copper) and equity indices. Choose which asset groups to show and whether to display the day change. Values stream live and flash on each tick.
Settings
Show
FX majors
Metals
Indices
Day change
Showdefault
Hide
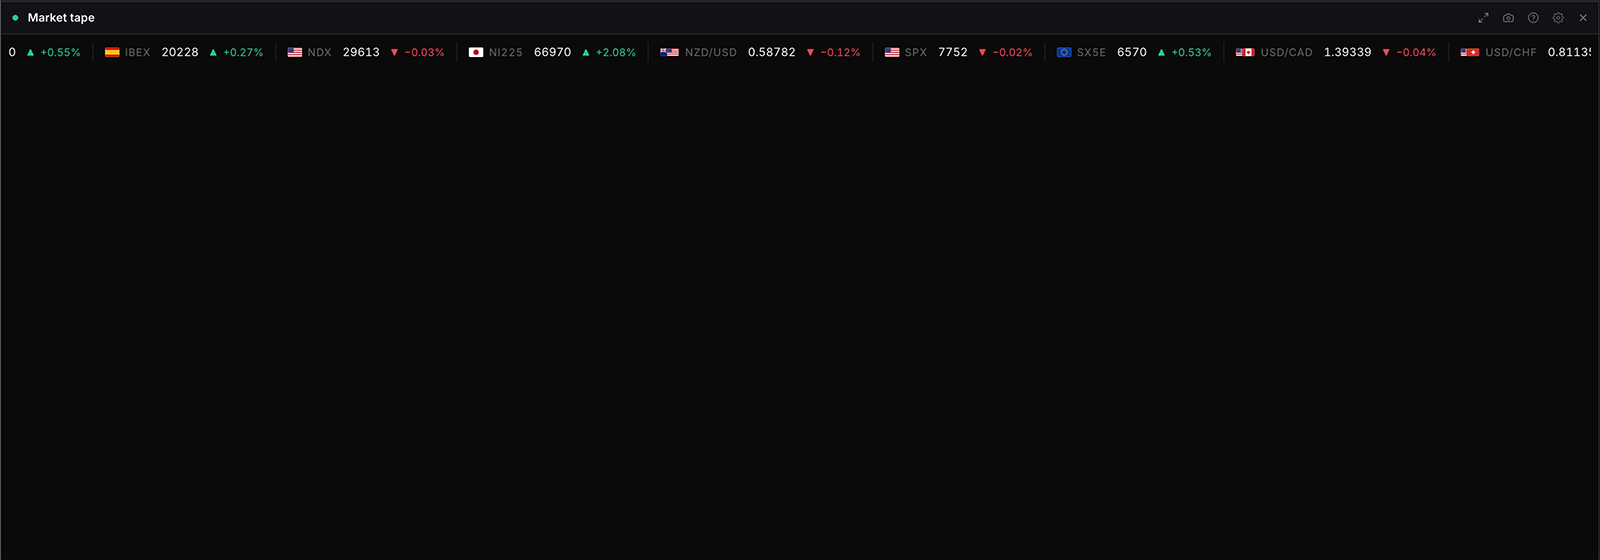
Market tape
market_tape
Free
A scrolling ticker of live prices across FX, metals, commodities and indices, with direction arrows and a flash on each move.
Settings
Show
FX majors
Metals
Indices
Speed
Slow
Normaldefault
Fast
Day change
Showdefault
Hide
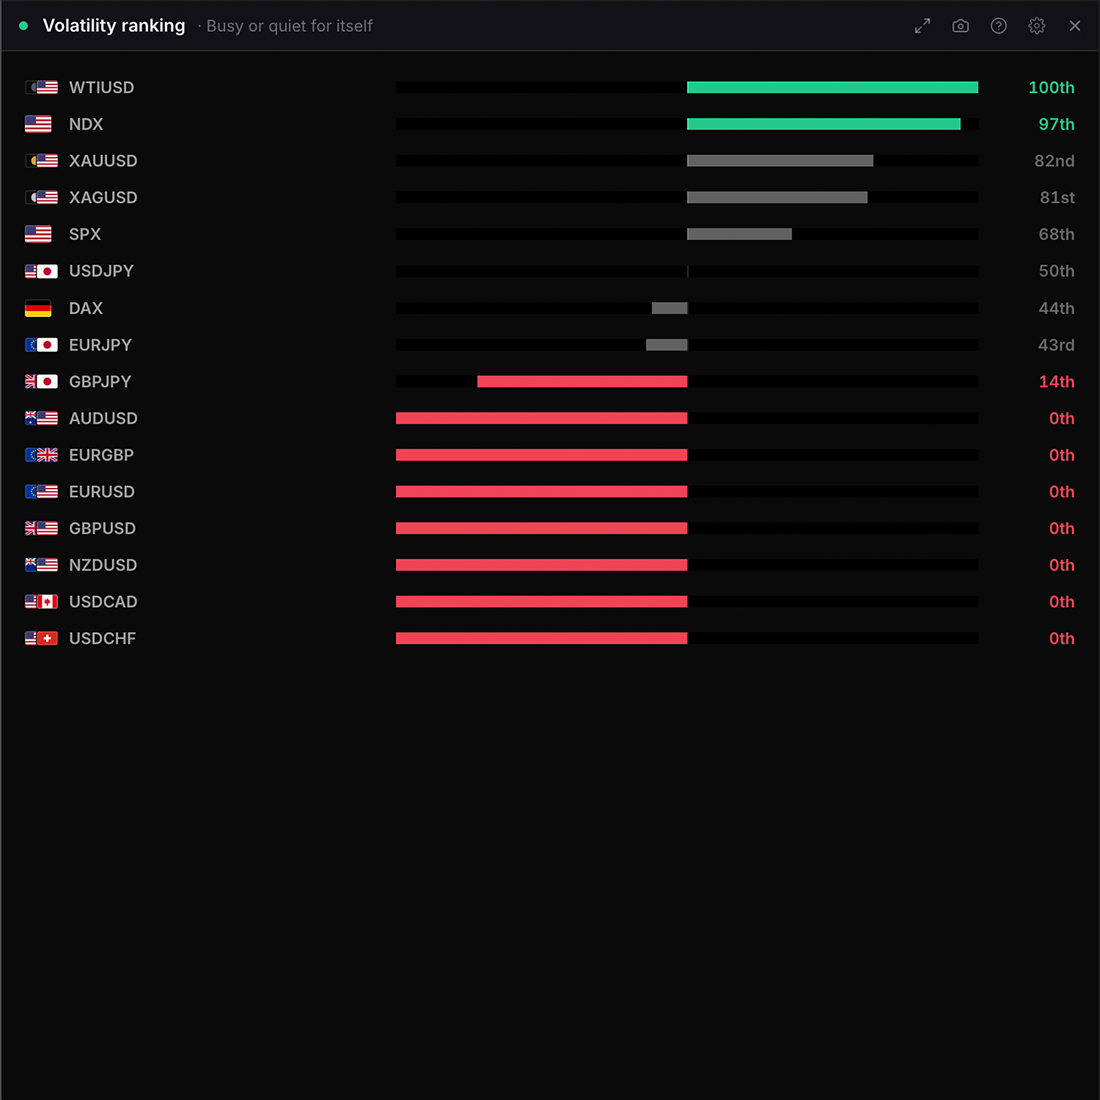
Volatility ranking
volatility
Free
Realised volatility and average daily range across selected assets, ranked: FX pairs, metals, WTI and equity indices. Annualised volatility (standard deviation of daily returns) and ATR as a percent of price, computed from daily history. Shows which markets are moving, not which way.
Settings
Visualisation
Ranking by raw volatility mostly ranks structure: a yen
Busy or quiet for itselfdefault
Ranked by volatility
Average daily range
Table
Assets
Each asset is one request, so a long list is slower.
Choices are built from whatever the data currently
covers, so the list changes with the markets on the board.
Volatility window
10 days
21 daysdefault
63 days
252 days
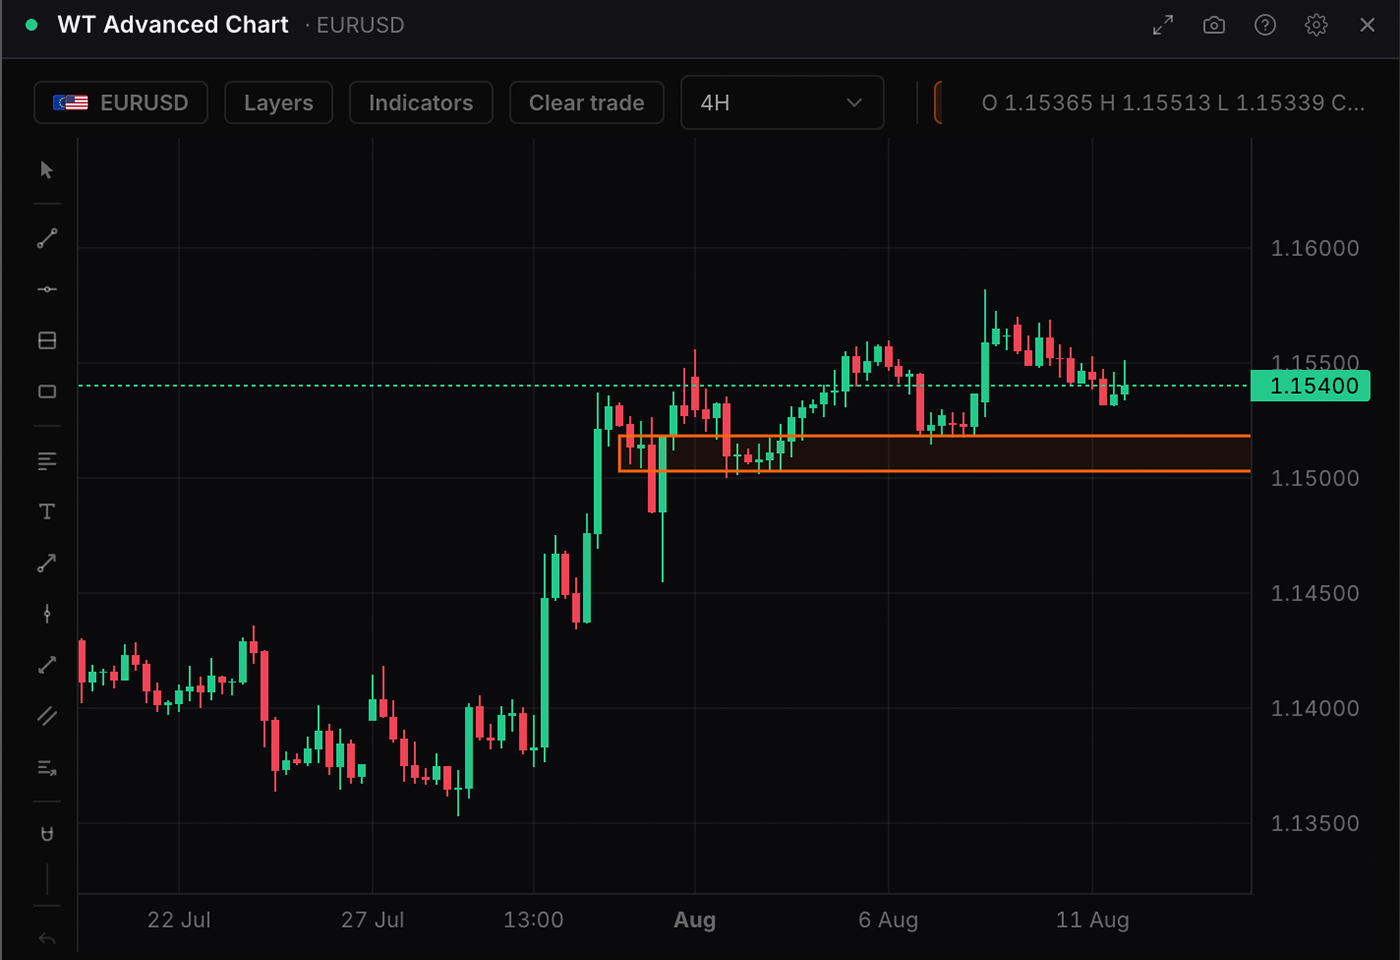
WT Advanced Chart
wt_chart
Free
WatchTower native chart. 44 assets: FX, metals, commodities, indices. Candles, area or line, across 5m to 1M timeframes.
Settings
Asset
The timeframe and every drawing tool live on the chart itself.
Choices are built from whatever the data currently
covers, so the list changes with the markets on the board.
Timeframe
Choices are built from whatever the data currently
covers, so the list changes with the markets on the board.
Remember my setup
Indicators are saved against the symbol and follow it onto any chart; starting clean neither reads nor adds them. Drawings always follow the symbol, on every chart.
Keep my indicatorsdefault
Start without indicators
Grid
Horizontal and vertical rules at the axis ticks, in the same hairline every panel border uses.
Showdefault
Hide
Chart type
Candlesdefault
Line
Area
Currency fundamentals
5 widgets
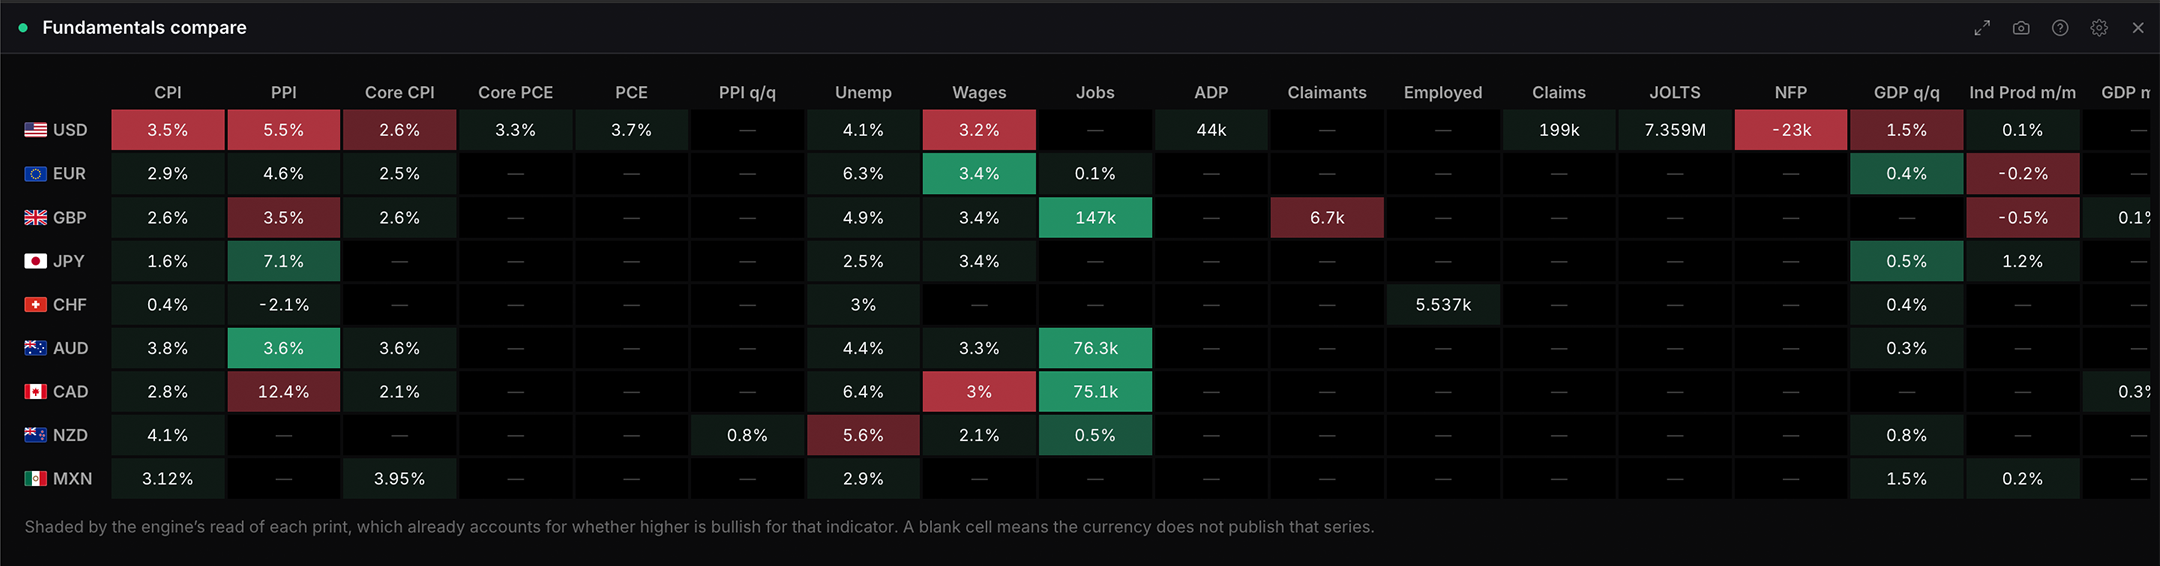
Fundamentals compare
macro_drilldown
Free
Compare the full macro fundamentals of currencies side by side: every tracked indicator (CPI, PPI, Services & Manufacturing PMI, GDP, unemployment, retail sales, trade balance and more) plus seasonality, the real latest prints in one grid. Indicators run down the left grouped by category; currencies across the top. Pick currencies by preset or type your own.
Settings
Currencies
The US alone publishes thirteen series, so the grid defaults to one category at a time.
Choices are built from whatever the data currently
covers, so the list changes with the markets on the board.
Category
The US alone publishes thirteen series, so the grid defaults to one category at a time.
Every indicator
Visualisation
Indicator griddefault
Rank one indicator
Table
Indicator
No indicators available
Shading
The read is direction-adjusted: a higher unemployment print shades bearish, a higher GDP print bullish.
None
Flags
Showdefault
Hide
Density
Comfortabledefault
Compact
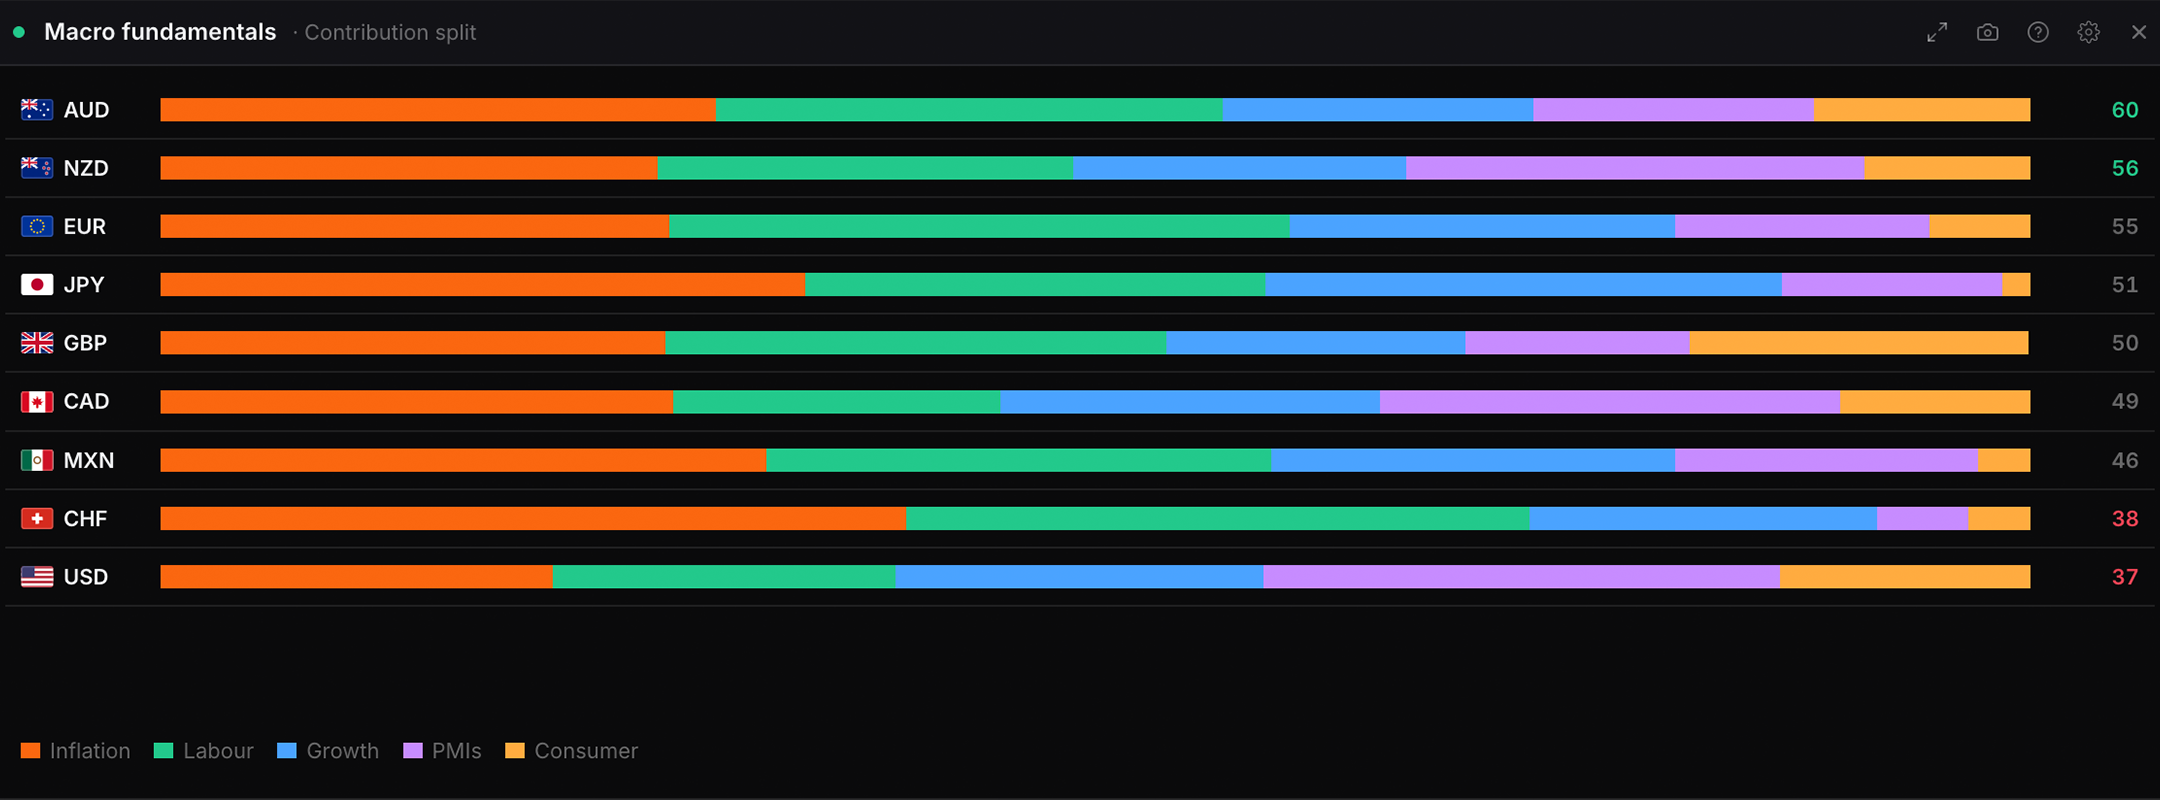
Macro fundamentals
macro_fundamentals
Free
The fundamentals score for each currency. Bar style breaks each currency into its per-category contributions; heatmap style puts one row per indicator, colour-coded across every currency.
Settings
Currencies
Pick everything, a whole class, or any combination of individual assets.
Choices are built from whatever the data currently
covers, so the list changes with the markets on the board.
Visualisation
Ranked scoresdefault
Category grid
Contribution split
Table
Flags
Showdefault
Hide
Density
Comfortabledefault
Compact
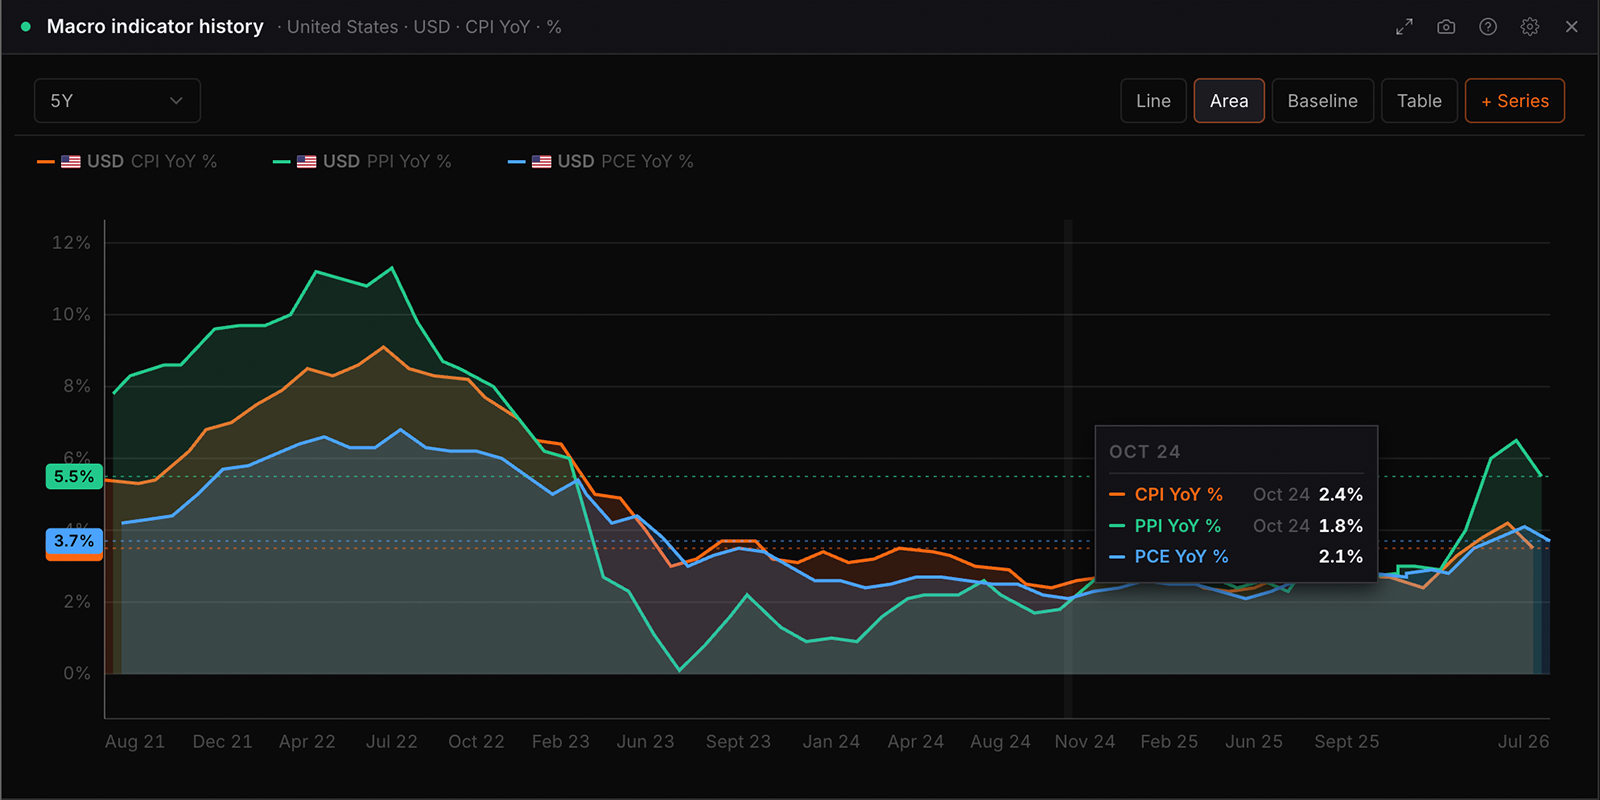
Macro indicator history
historical_macro_chart
Free
Any currency and indicator through time, as bars or a line. 24 months by default, with forecast dots overlaid on the actuals. Hover a point for the surprise against consensus.
Settings
Country
Choices are built from whatever the data currently
covers, so the list changes with the markets on the board.
Indicator
Scored macro releases plus market reference series.
Choices are built from whatever the data currently
covers, so the list changes with the markets on the board.
History
Choices are built from whatever the data currently
covers, so the list changes with the markets on the board.
Last value line
A dashed guide and value tag at each series\u2019 most recent print.
Showdefault
Hide
Summary strip
Latest print, consensus and release count above the plot. The chart already carries the last value and the release count in its stamp.
Show
Hidedefault
Chart controls
Range and chart type as buttons above the plot. Turn off for a bare chart on a dense board.
On the chartdefault
Settings only
Visualisation
Line
Areadefault
Baseline (+/-)
Columns
Table
Scale
Automatic uses one axis for one unit, two axes for two, and indexes when there are more.
Automaticdefault
One axis
Two axes
Indexed to 100
Consensus
One series: the published consensus is drawn against the print, on lines and on columns alike. Several series: each one reports how often it printed above, below and in line, which is the comparison four overlaid forecast lines would bury.
Showdefault
Actual only
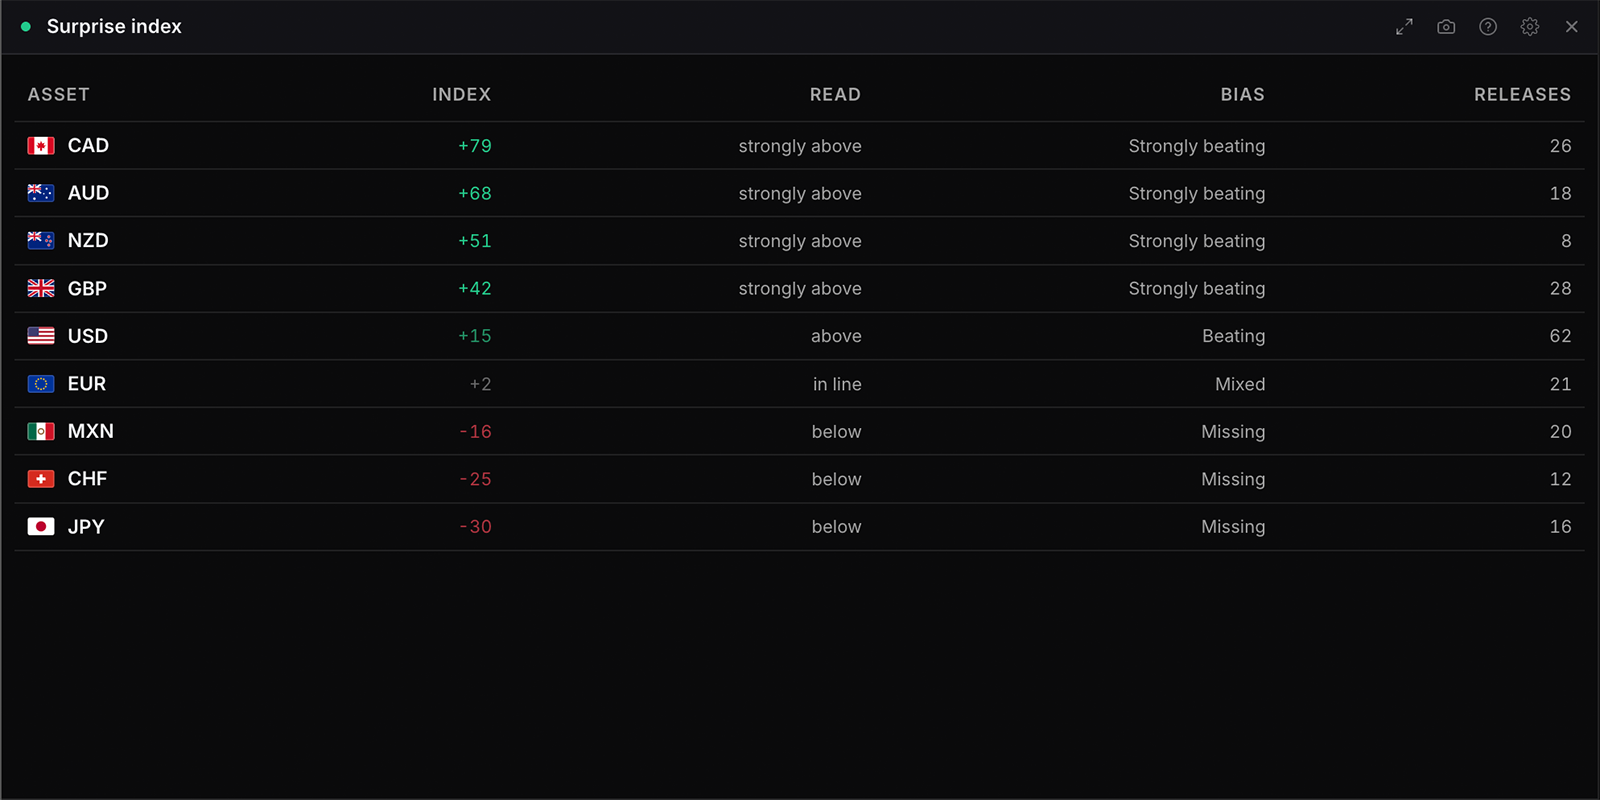
Surprise index
surprise_index
Free
How each currency's recent data has landed against consensus, weighted by the importance of each release and how recently it printed. A rising reading means data is beating expectations, which measures momentum in the data rather than a direction for the currency.
Settings
Currencies
An index built on very few releases moves violently on one print.
Choices are built from whatever the data currently
covers, so the list changes with the markets on the board.
Visualisation
Rankeddefault
Strip
Table
Minimum releases
An index built on very few releases moves violently on one print.
Show everythingdefault
At least 3
At least 6
Flags
Showdefault
Hide
Density
Comfortabledefault
Compact
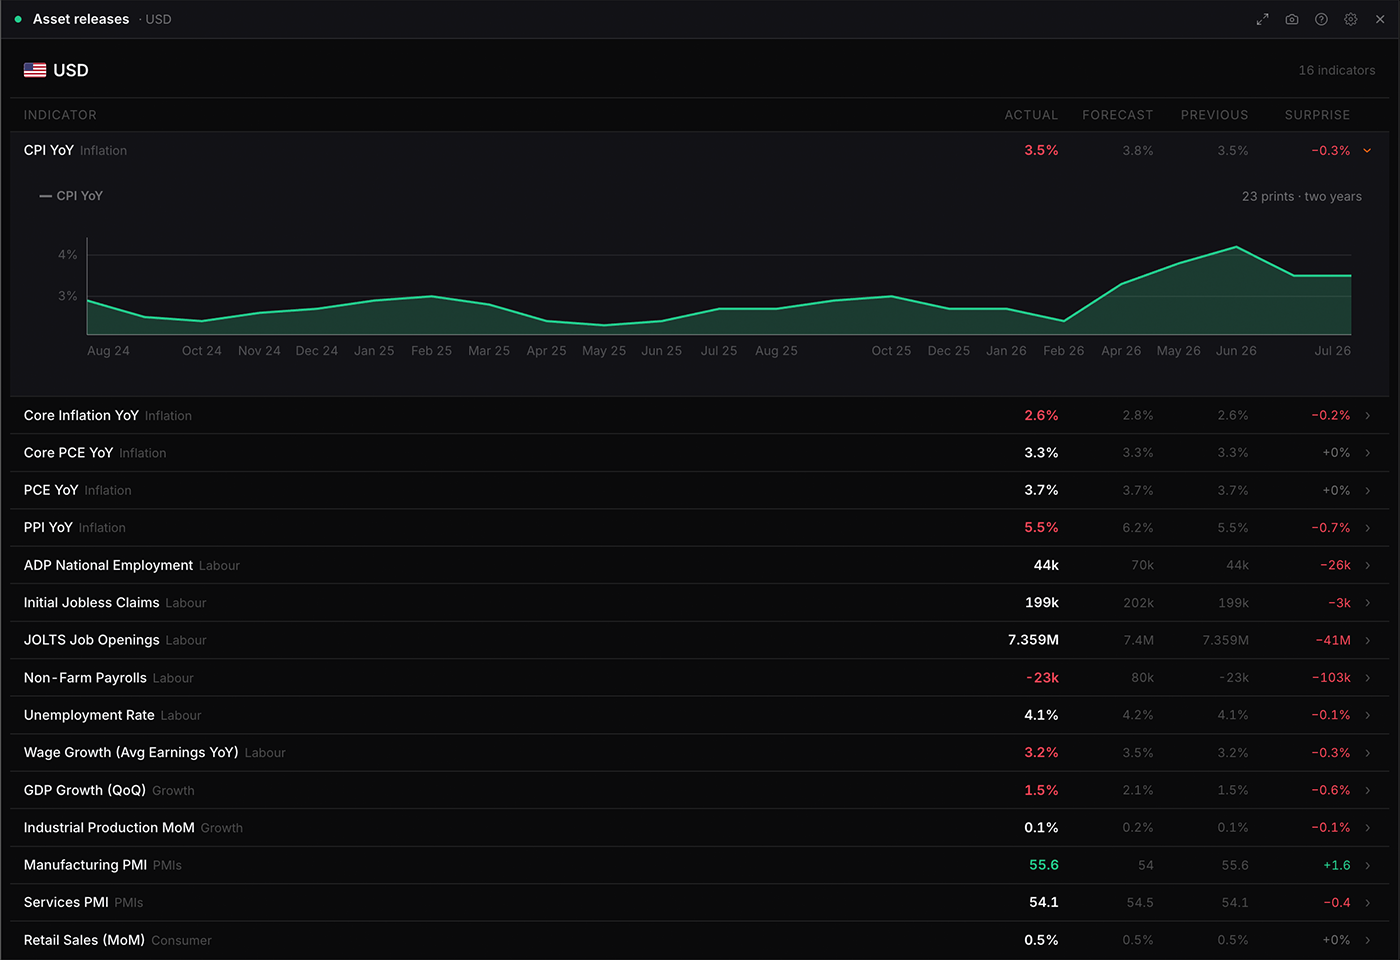
Asset releases
macro_matrix
Free
Every scored release for one asset in one table: what it printed, what was expected, what it was before, and the engine's read on each. A row opens to two years of history. For the same indicators compared across currencies, use Fundamentals compare.
Settings
Asset
Choices are built from whatever the data currently
covers, so the list changes with the markets on the board.
Category
Every indicatordefault
Sort by
Categorydefault
Biggest surprise
Name A\u2013Z
Density
Comfortabledefault
Compact
Portfolio
10 widgets
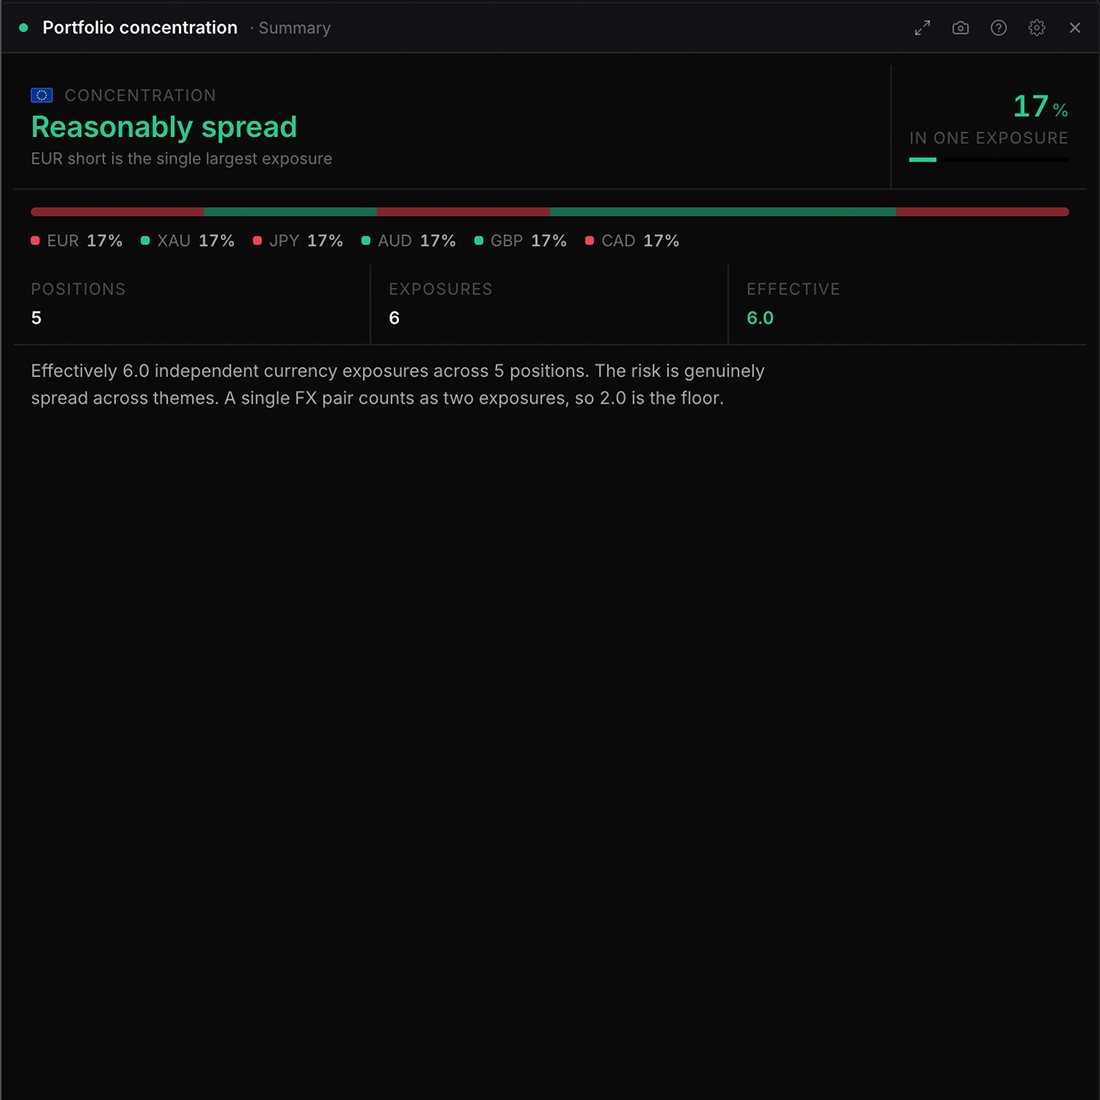
Portfolio concentration
portfolio_concentration
Free
How much of your notional sits on a single bet. Distils your net currency exposure into one concentration reading plus an effective number of independent bets, with a stacked bar of where the risk sits. Exposure-weighted; for what actually moves together, use Portfolio correlation.
Settings
Visualisation
Summarydefault
Table
Flags
Showdefault
Hide
Conviction check
portfolio_conviction
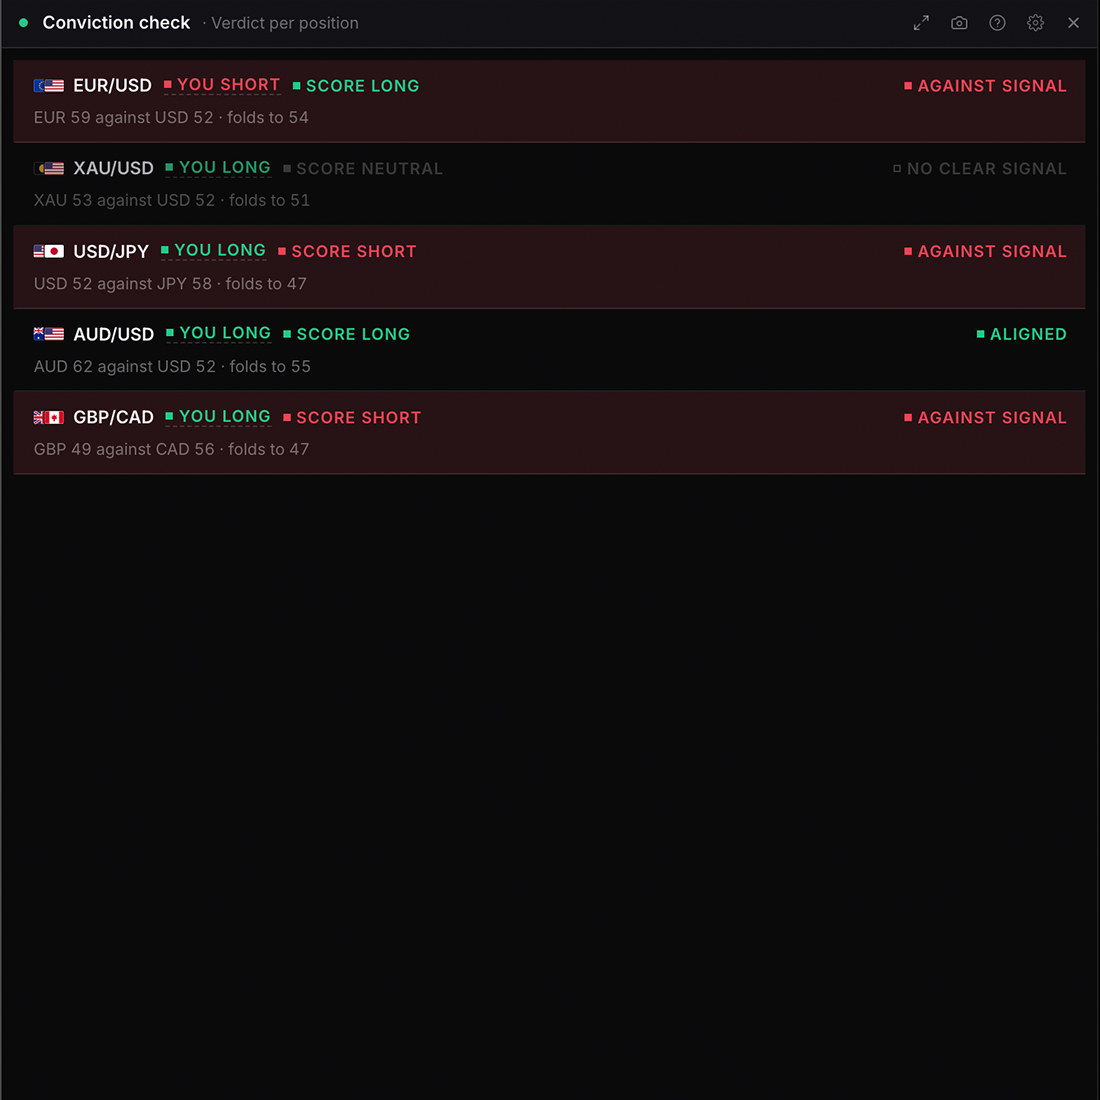
Free
Your trade direction versus the score-implied direction, position by position. Green where you are trading with the composite score, red where you are fighting your own signal.
Settings
Neutral band
How far from neutral a score has to sit before it counts as taking a side. Inside the band the row reads no clear signal rather than being called aligned or against.
\u00b11 point from 50
\u00b12 points from 50default
\u00b15 points from 50
Show
Every positiondefault
Only those fighting the score
Visualisation
Verdict per positiondefault
Table
Flags
Showdefault
Hide
Event radar
portfolio_event_radar
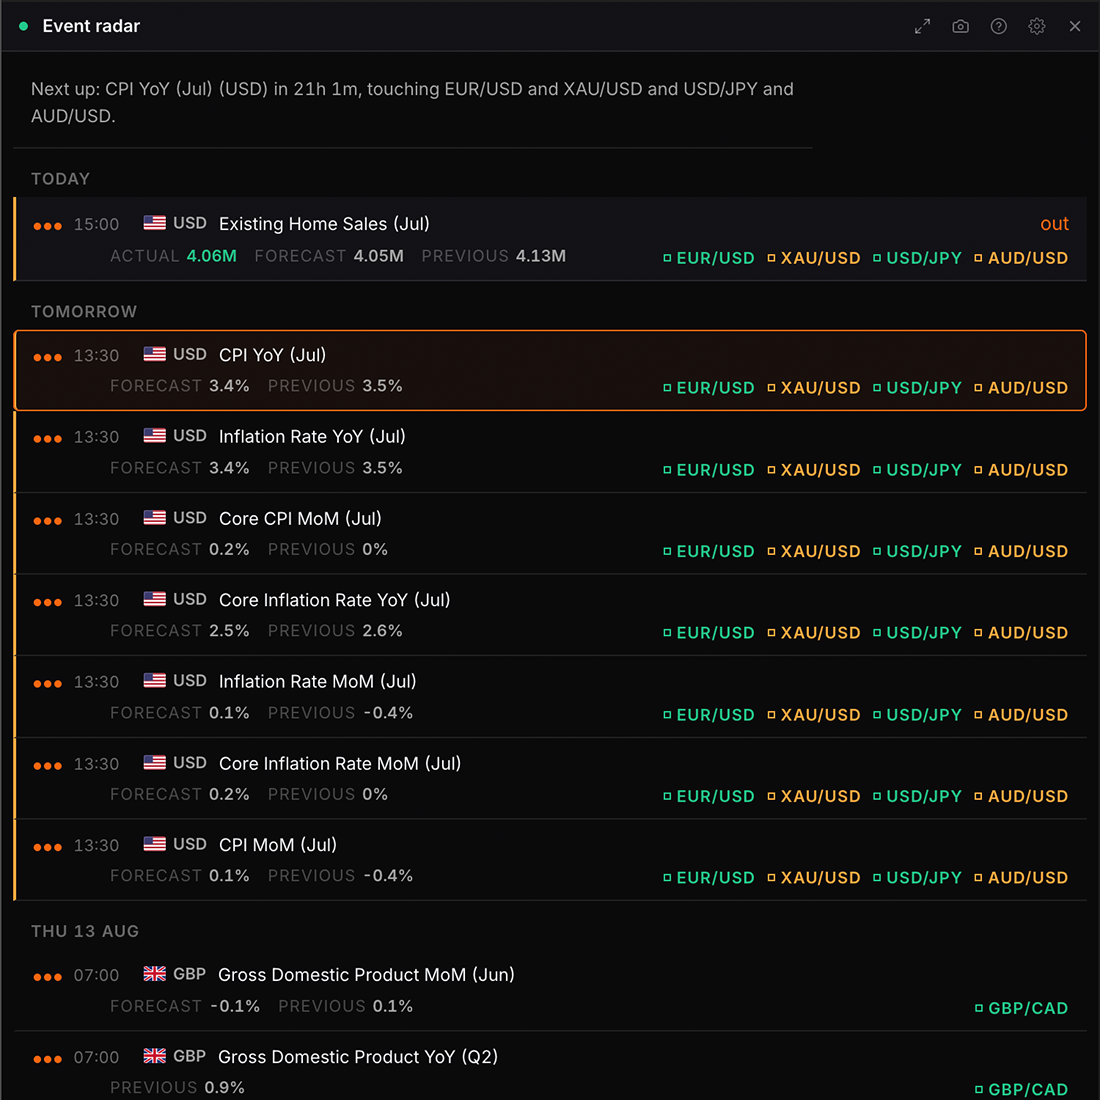
Free
Upcoming high-impact economic events for the currencies in your book, ranked by proximity, each mapped to the positions it touches: so you know what is about to move your portfolio and where.
Settings
Window
The feed holds 30 days forward, so that is the furthest view available.
Next 24 hours
Next 3 days
Next 7 daysdefault
Next 30 days
Impact
High onlydefault
Medium and high
Everything
Visualisation
Agendadefault
Table
Flags
Showdefault
Hide
My portfolio
watchlist
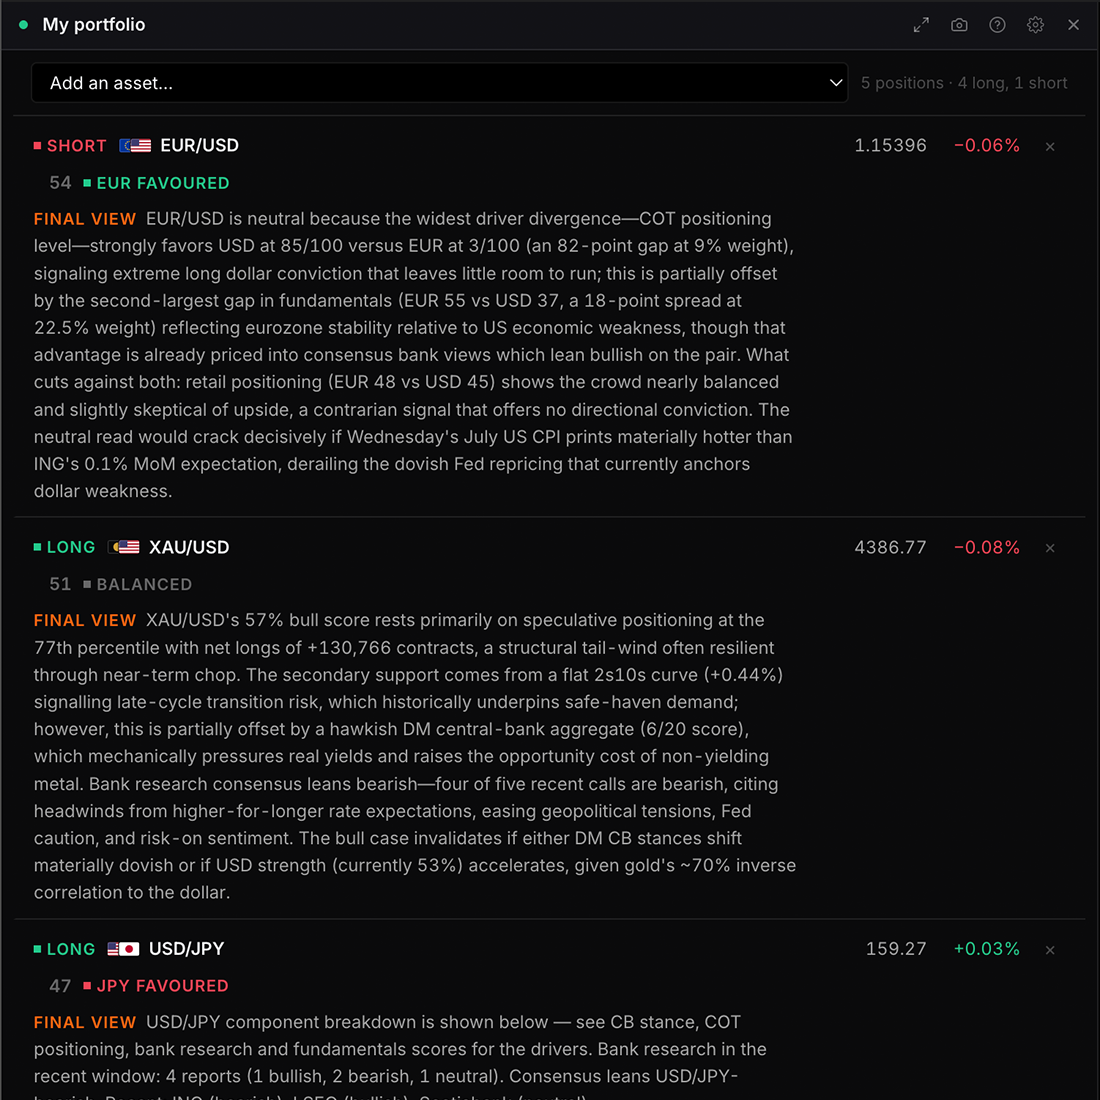
Free
Your book in one panel: live price and change, the composite score, which leg the engine favours, and the full written read on each pair. Add and remove positions here, and set each one long or short.
Settings
Sort by
As saveddefault
Score
Day change
A to Z
Show
The Final view is the engine\u2019s full written read on the pair. It needs the AI explain feature on your plan; without it the panel shows the ungated per-currency read instead.
Price
Day change
Score and lean
Final view
Flags
Showdefault
Hide
Density
Comfortabledefault
Compact
Portfolio briefing
portfolio_briefing
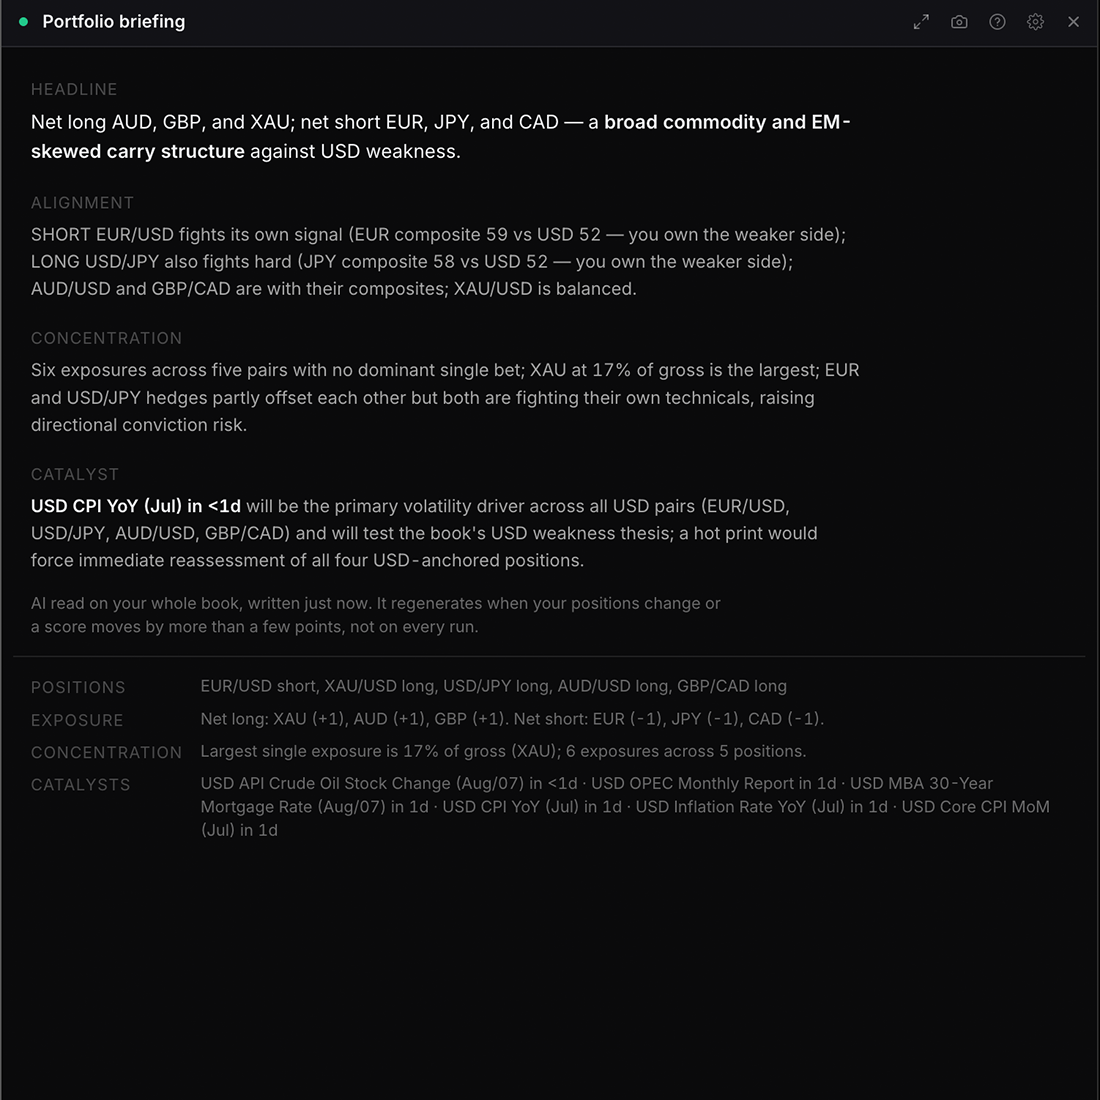
Pro
An AI risk read on your whole book: what it is betting on, whether it aligns with the composite scores, how concentrated it is, and the single key upcoming catalyst. Regenerates when your positions or the scores meaningfully change.
Settings
What it was built from
The positions, exposure, concentration and upcoming events sent with the request. A written read is worth less if you cannot see what it was given.
Showdefault
Hide
Portfolio correlation
portfolio_correlation
Free
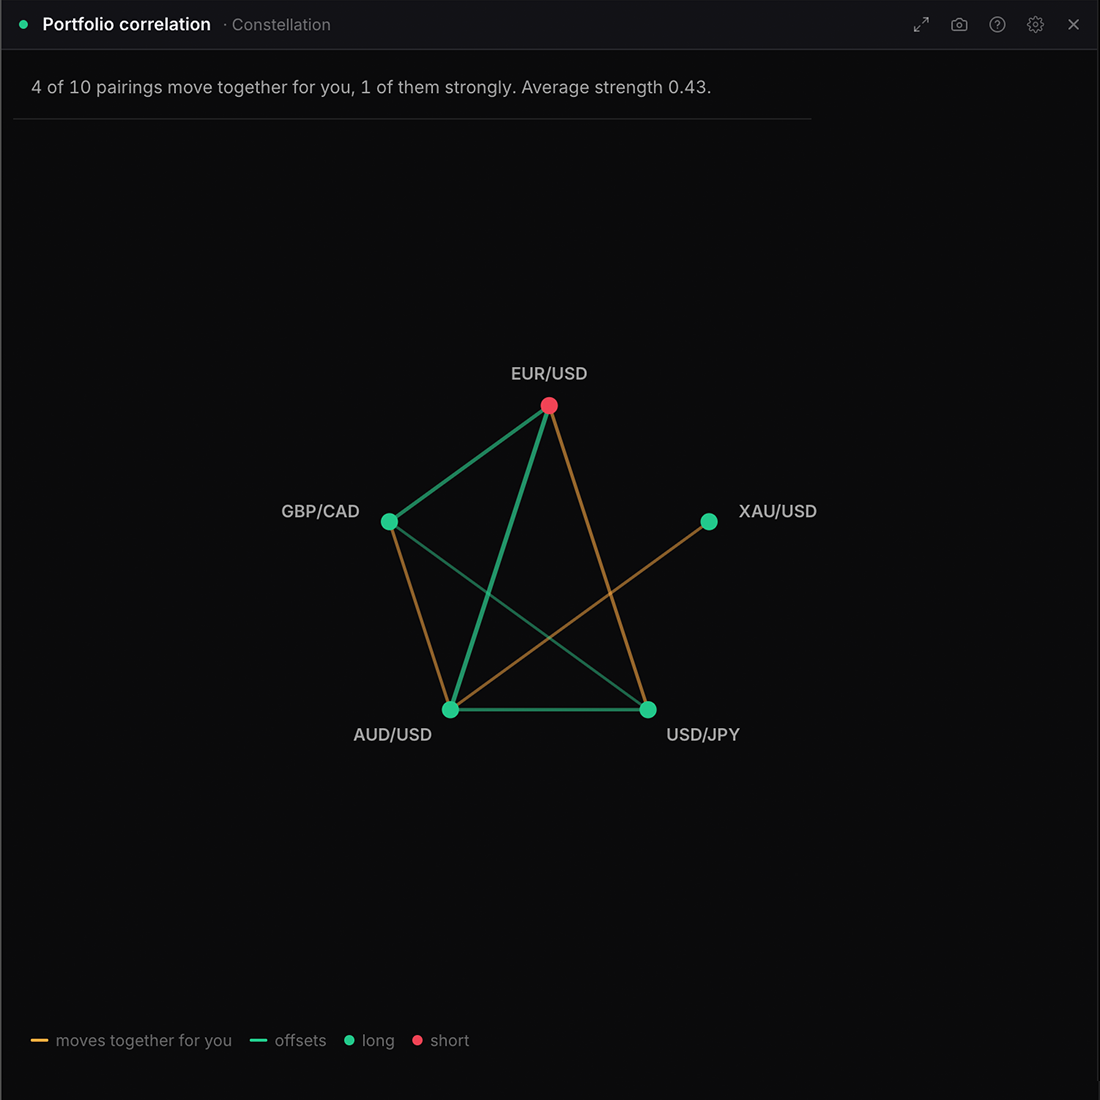
Whether your positions move as one. Correlates the daily returns of your holdings over a real window, then signs each pairing by the side you are trading it, so a positive reading always means two positions that win and lose together, whichever way each is pointed.
Settings
Window
Daily returns over this many shared sessions. A shorter window is more responsive and noisier.
30 days
60 daysdefault
120 days
Read as
Your risk multiplies each correlation by the side you are trading both positions, so a positive number always means the two win and lose together. Raw ignores your direction.
Your riskdefault
Raw price correlation
Draw links above
0.2
0.3default
0.5
Visualisation
Constellationdefault
Matrix
Ranked pairings
Portfolio exposure
portfolio_exposure
Free
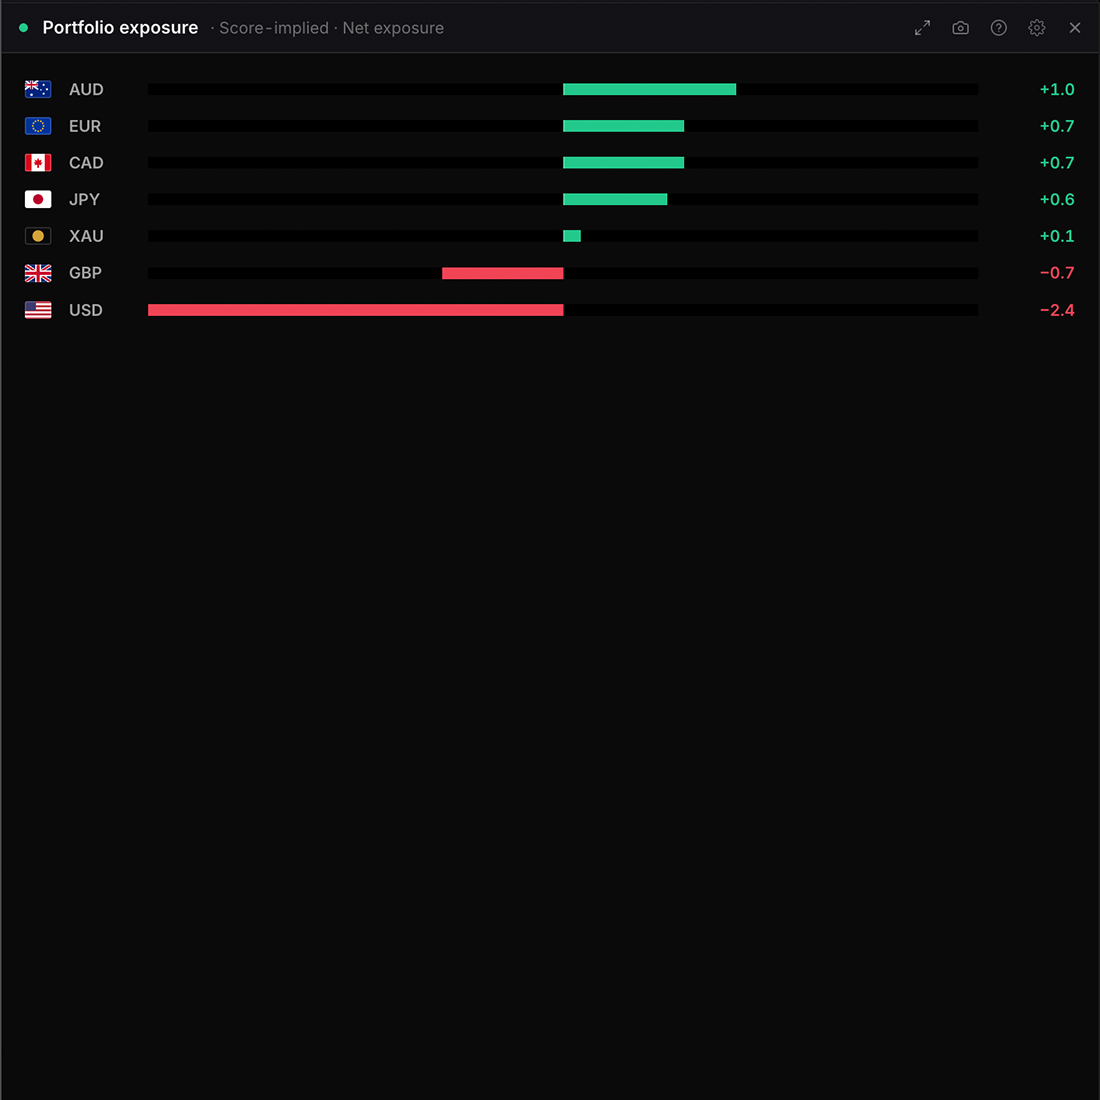
Net currency exposure across your positions: which currencies you are effectively long and which you are short, once the pairs are broken into their two legs. Read it from the sides you actually set, or from the sides the composite scores imply, which is the book the engine would hold instead of yours.
Settings
Direction basis
Your book counts each position \u00b11 in the direction you set. Score-implied ignores your side and sizes each pair by the gap between its two composite scores, which is the book the engine would hold.
The way you are trading itdefault
Score-implied
Visualisation
Net exposuredefault
Table
Flags
Showdefault
Hide
Portfolio prices
watchlist_prices
Free
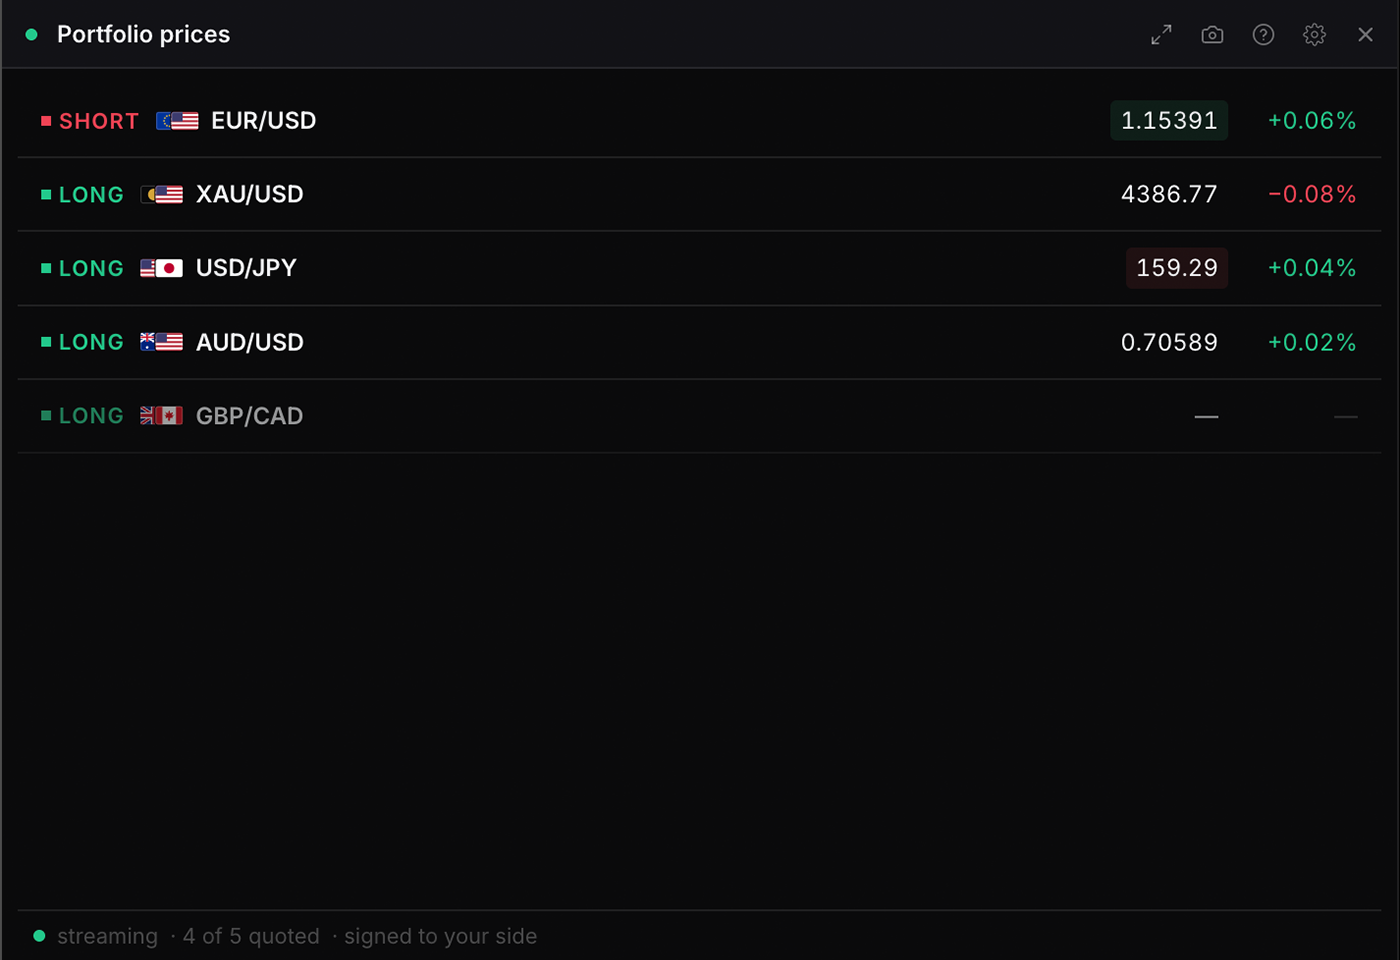
Your portfolio assets with live prices and change%, flashing on every tick. Auto-updates as you add or remove from your portfolio.
Settings
Sort by
As saveddefault
Day change
A to Z
Direction
With your side shown, the change column is signed the way the position is actually going: a short gaining reads green.
Show your sidedefault
Prices only
Flags
Showdefault
Hide
Density
Comfortabledefault
Compact
Portfolio changes
portfolio_changes
Free
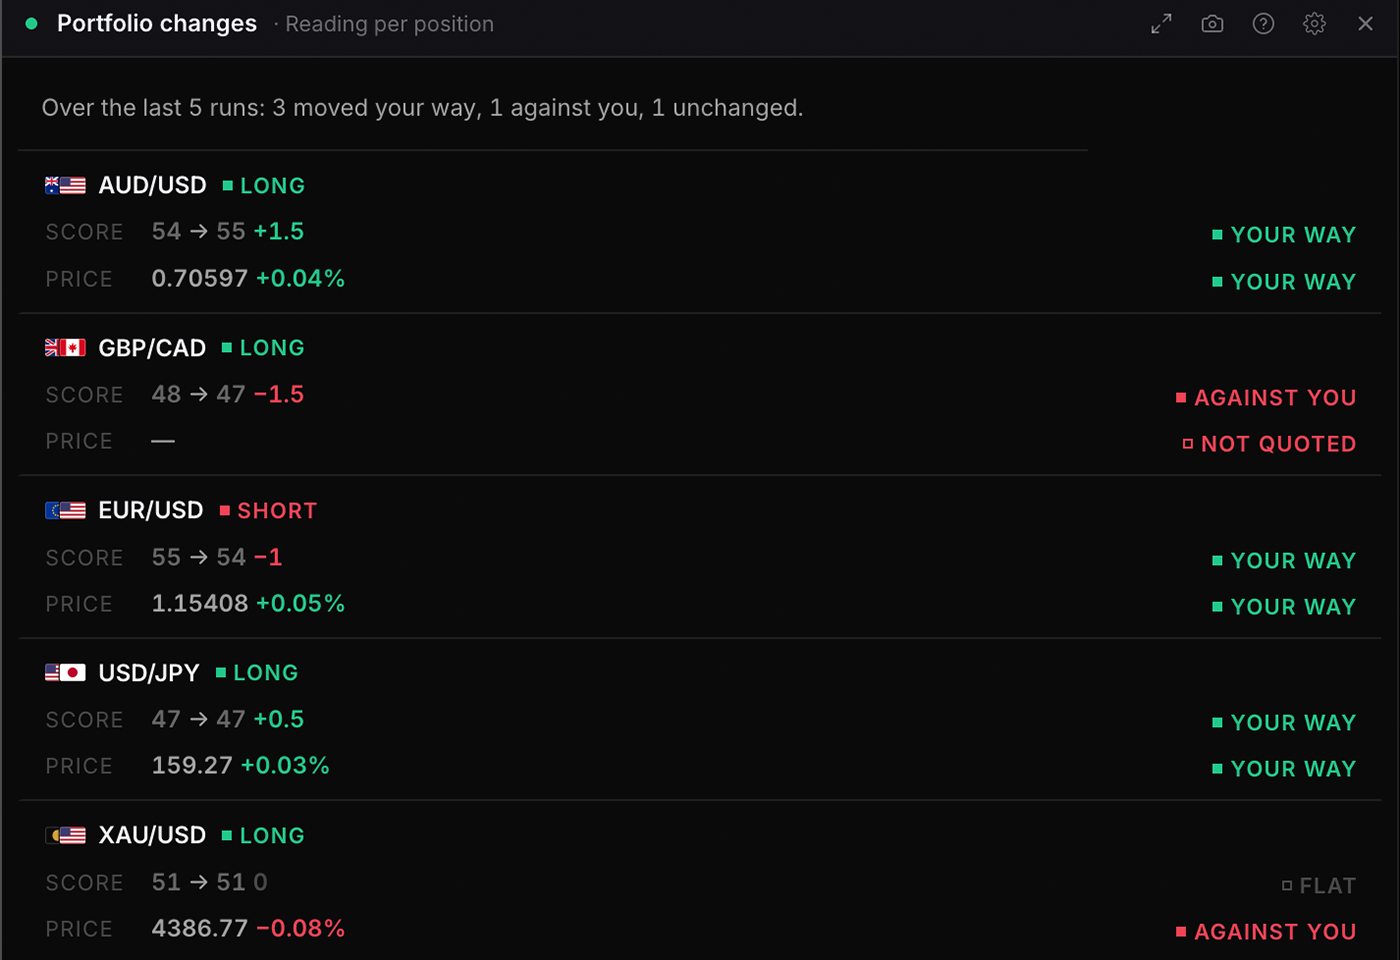
What has moved under the positions you hold, and whether it moved your way. Composite score and day price change for each one, signed to the side you are trading it. Measured in scoring runs against the recorded history, so it reads the same on any device.
Settings
Compared with
Counted in scoring runs rather than days. The runs are dated but not evenly spaced, so one run is not a fixed amount of time. Scores move slowly, so one run is often flat across a whole book.
The previous run
5 runs agodefault
10 runs ago
20 runs ago
Price move
The day change on each position, signed to the side you are trading it.
Showdefault
Hide
Visualisation
Reading per positiondefault
Table
Minimum move
Every positiondefault
Moved 1 point or more
Moved 3 points or more
Flags
Showdefault
Hide
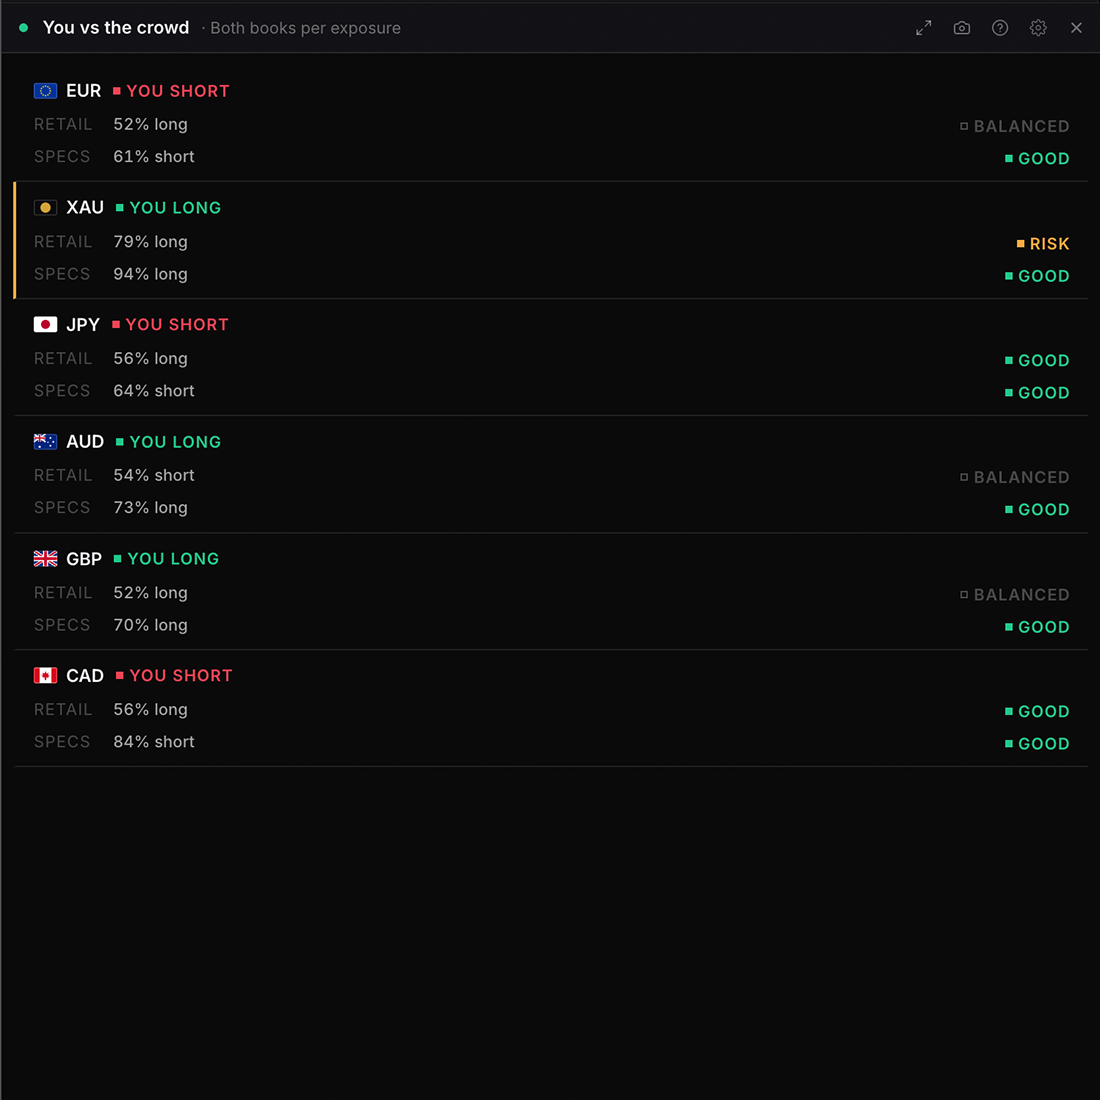
You vs the crowd
portfolio_crowd
Free
How your positions sit against retail sentiment and COT smart money, currency by currency. Fading a crowded retail book (alongside the specs) is the contrarian sweet spot; siding with heavy retail is the crowded risk.
Settings
Crowding band
How far a book must lean before it counts as crowded. Inside the band the row reads balanced rather than being called a crowd.
Loose (55/45)default
Standard (60/40)
Strict (70/30)
Show
Every exposuredefault
Only the crowded risks
Visualisation
Both books per exposuredefault
Table
Flags
Showdefault
Hide
Research & narrative
7 widgets
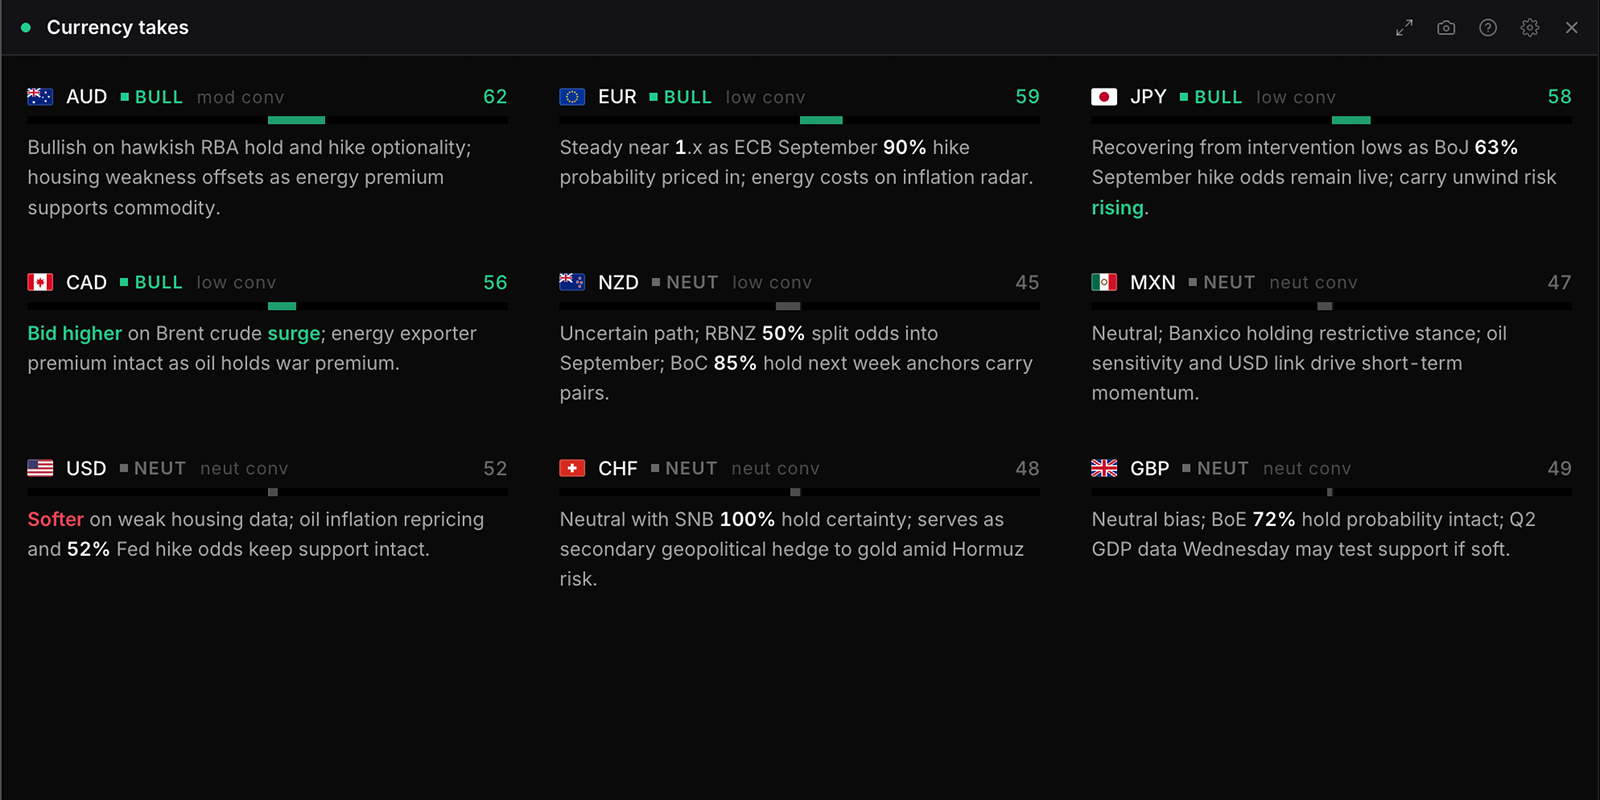
Currency takes
asset_snaps
Pro
A one-line read on every monitored currency, written by the engine at the latest scoring run. Each take reflects the score at that run, so it ages with the scoring cycle rather than with price.
Settings
Density
Compactdefault
Expanded (score bars)
Sort by
Conviction is distance from neutral, so a strongly bearish currency ranks alongside a strongly bullish one.
Convictiondefault
Score, strongest first
Alphabetical
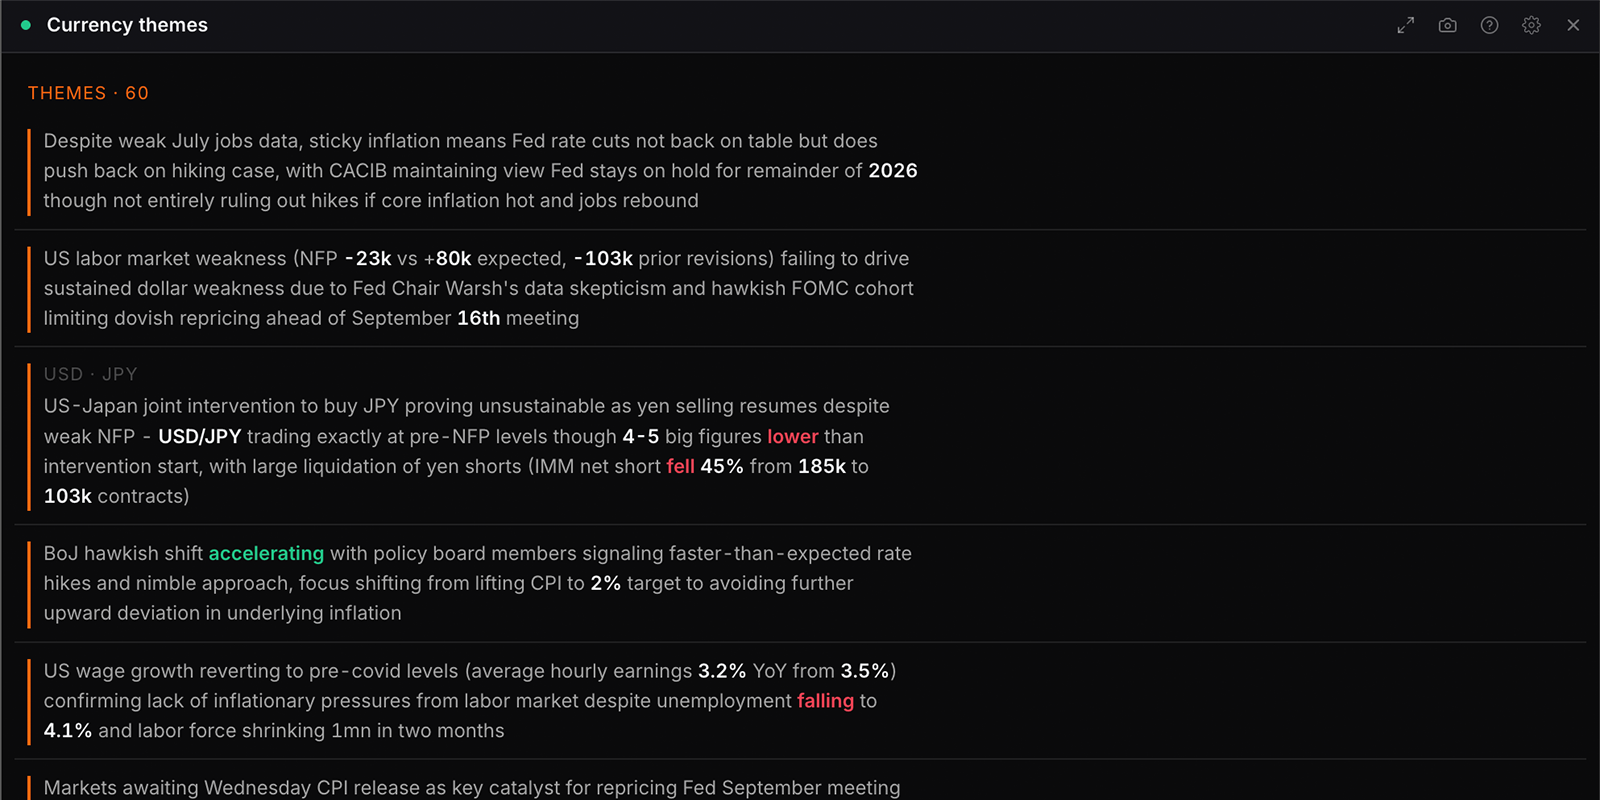
Currency themes
currency_themes
Pro
The macro themes and geopolitical risks tagged to one currency at the latest scoring run. These describe what the research and news flow are built around; they give context to the score rather than forming part of it.
Settings
Currency
Choices are built from whatever the data currently
covers, so the list changes with the markets on the board.
Scope
Entries are matched by mention, so one can appear under several currencies, and one naming none is only visible under all currencies.
Selected currencydefault
All currencies
Visualisation
Cardsdefault
Table
Keyword frequency
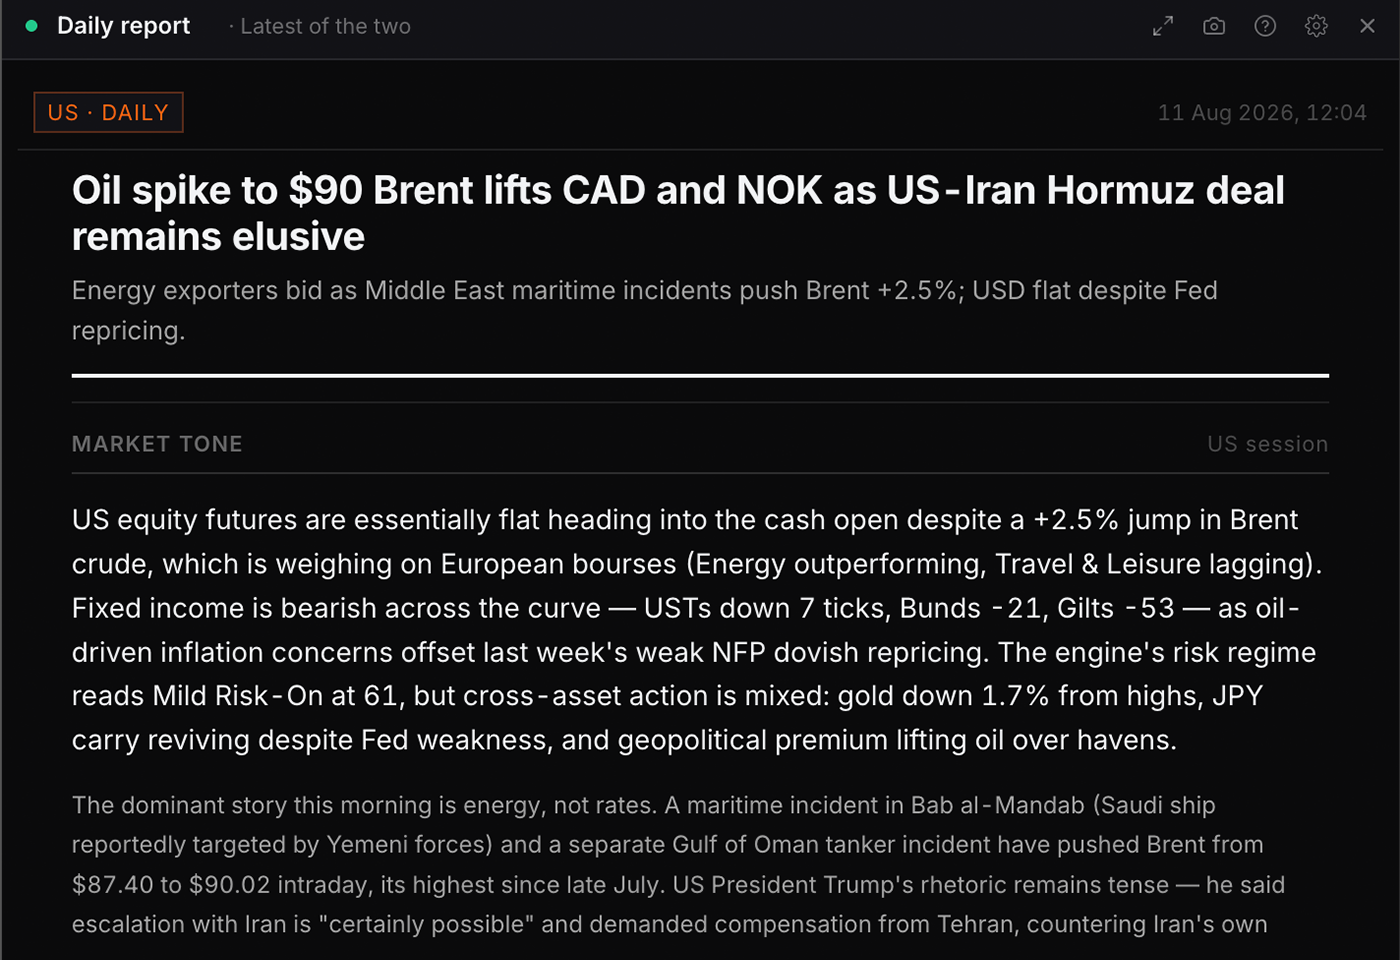
Daily report
daily_report
Free
The newest macro daily brief in full: choose the EU session (generated ~07:00 UTC) or the US session (~11:00 UTC). Auto-updates as fresh reports are generated. Click any element to open in the full reader.
Settings
Session
EU publishes around 07:00 UTC and US around 11:00 UTC.
Latest of the twodefault
EU session
US session
Density
Compactdefault
Expanded
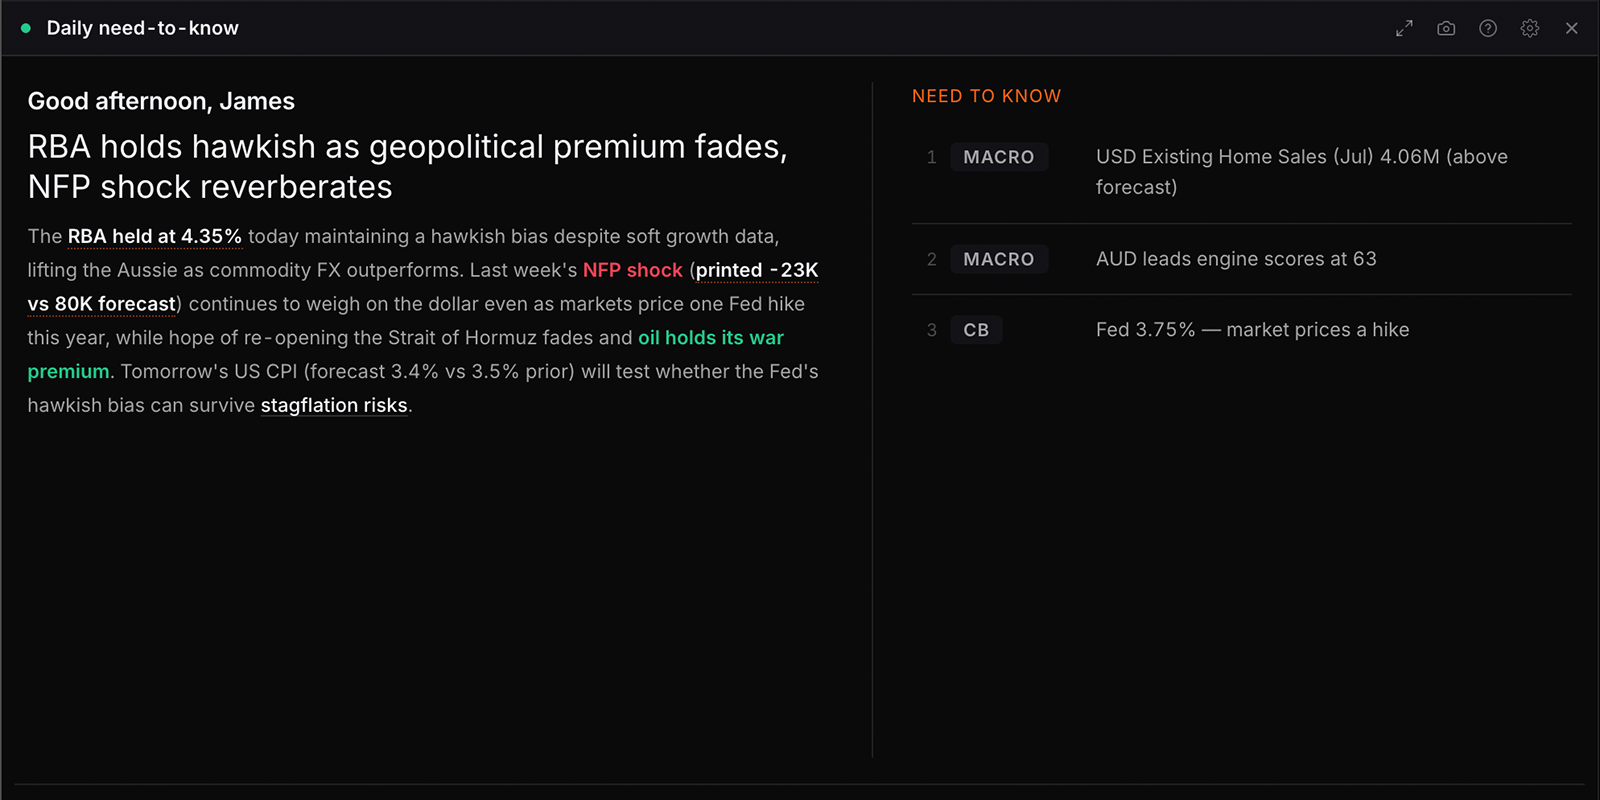
Daily need-to-know
daily_brief
Free
The short daily read: the lead macro headline, the paragraph behind it, and the numbered watch items. The brief and the watch list are written on different schedules, so each is dated separately and an ageing brief says so.
Settings
Content
Brief and watch itemsdefault
Brief only
Watch items only
Greeting
Taken from your own clock rather than from the data.
Showdefault
Hide
Watch items
Top 3default
Top 5
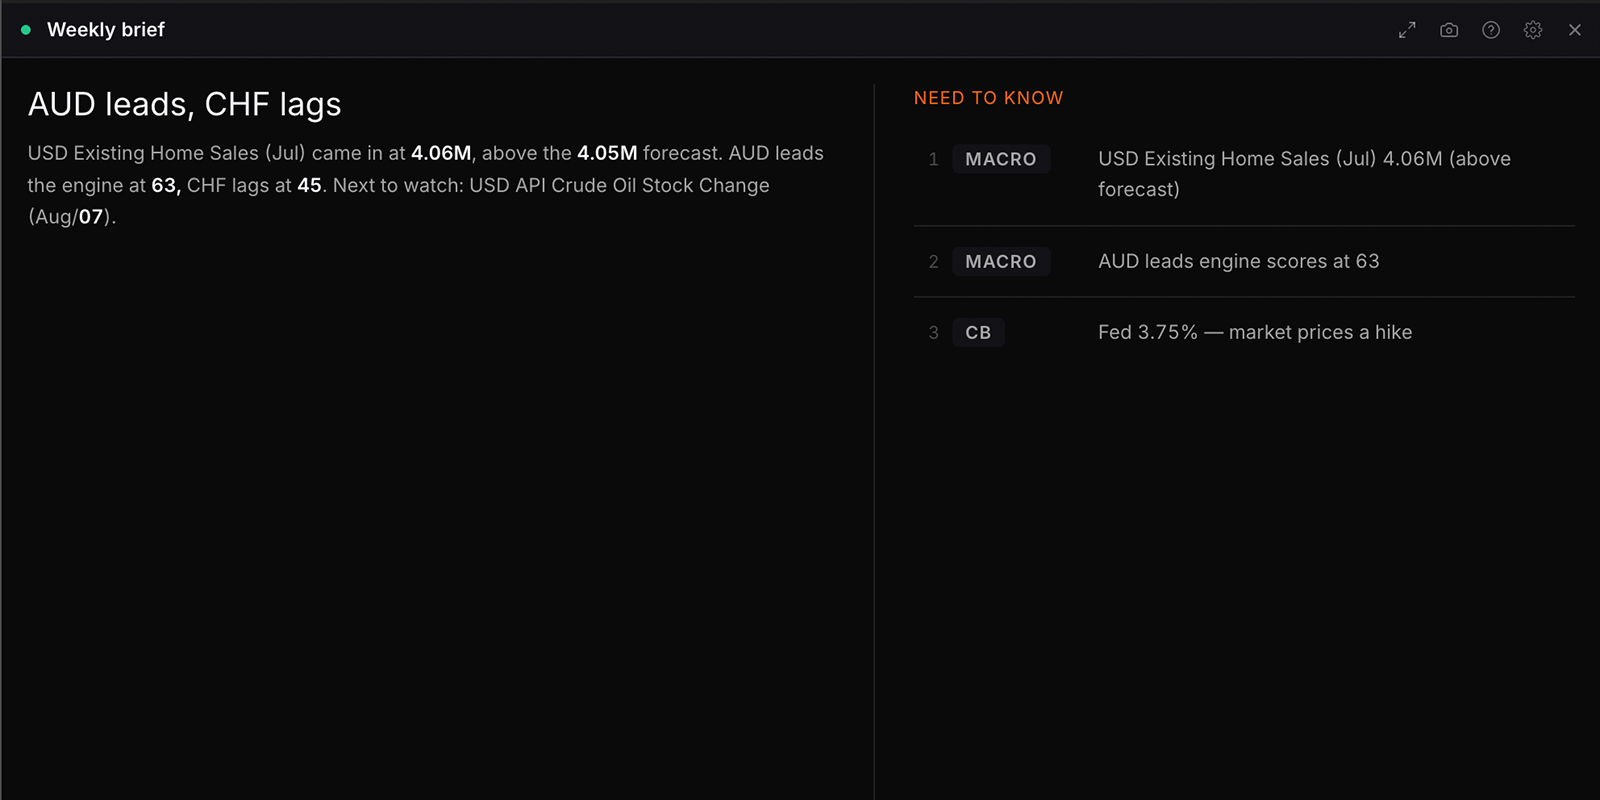
Weekly brief
todays_brief
Pro
The engine's own editorial for the week: the theme it is built around, the narrative written on it, and the numbered need-to-know watch items.
Settings
Content
Full editorialdefault
Need to know only
Theme and take only
Watch items
Top 3
Top 5default
All held
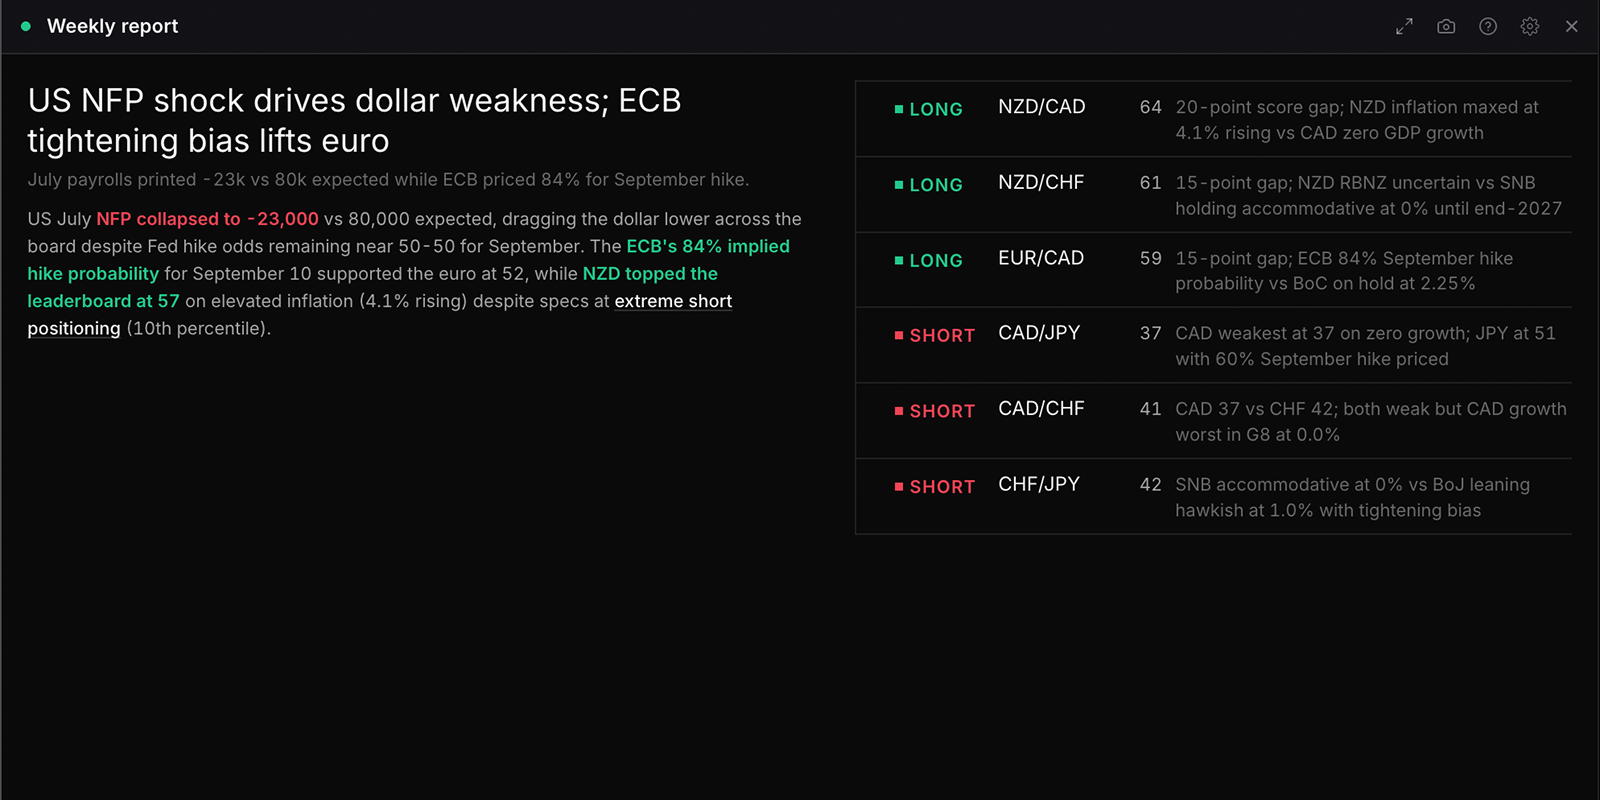
Weekly report
weekly_report_excerpt
Pro
The newest weekly report as a pinned card: what it led with, the section of your choice underneath, and the six pair ideas the engine captured when it was written, each with the reasoning published alongside it.
Settings
Visualisation
Carddefault
Pair ideas only
Summary only
Body text
Which section of the report the card carries under the headline.
Executive summarydefault
Market tone
Week ahead
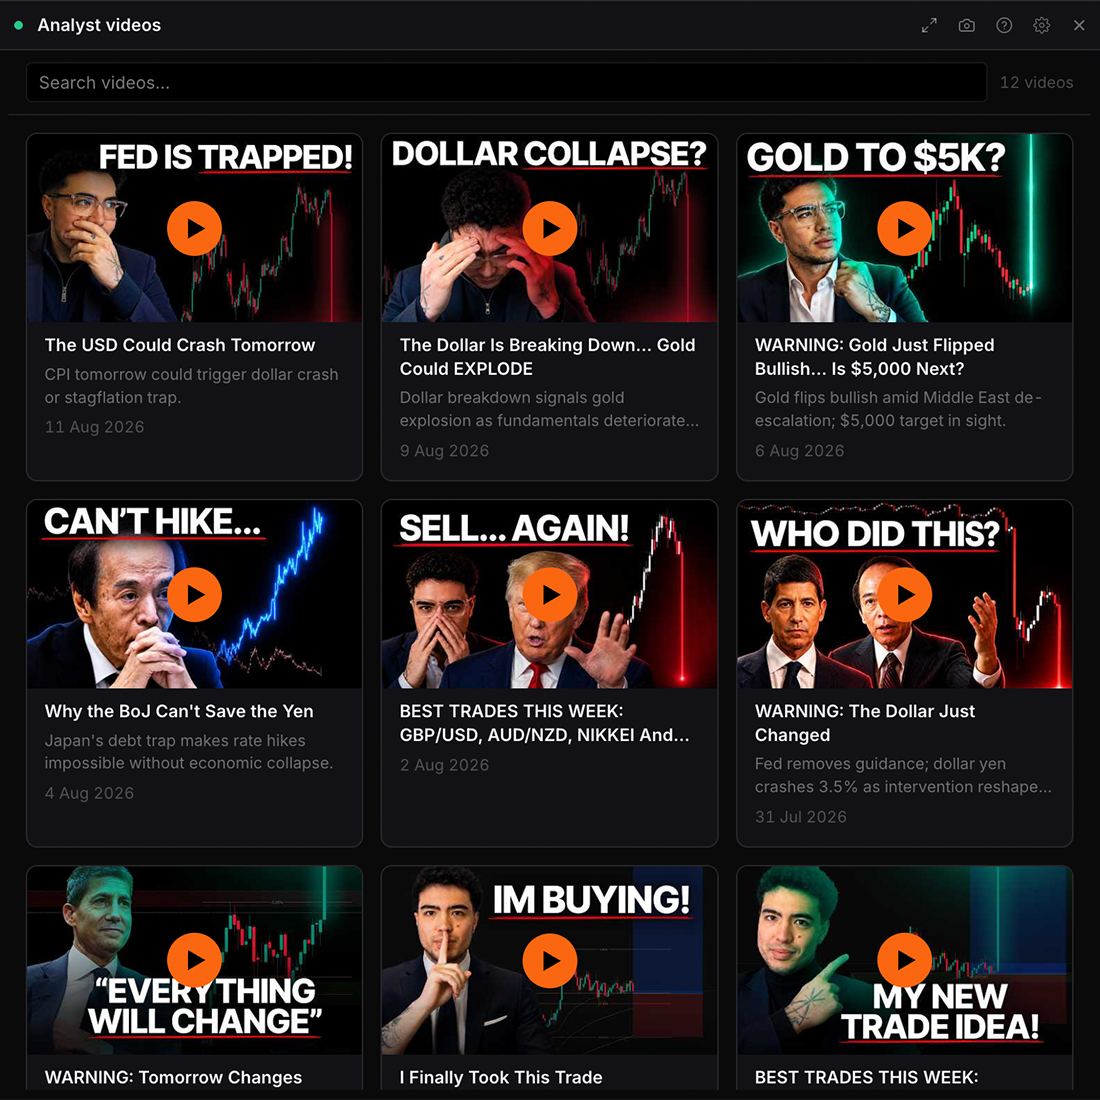
Analyst videos
analyst_videos
Free
The daily video desk: the hook, the written summary and the takeaways pulled from each transcript. Opening one plays it inside the panel rather than taking over the board.
Settings
Visualisation
Cards show the thumbnail. A list fits far more in a narrow panel and still carries the hook.
Cardsdefault
List
Show
12 most recentdefault
24 most recent
48 most recent
Risk & sentiment
4 widgets
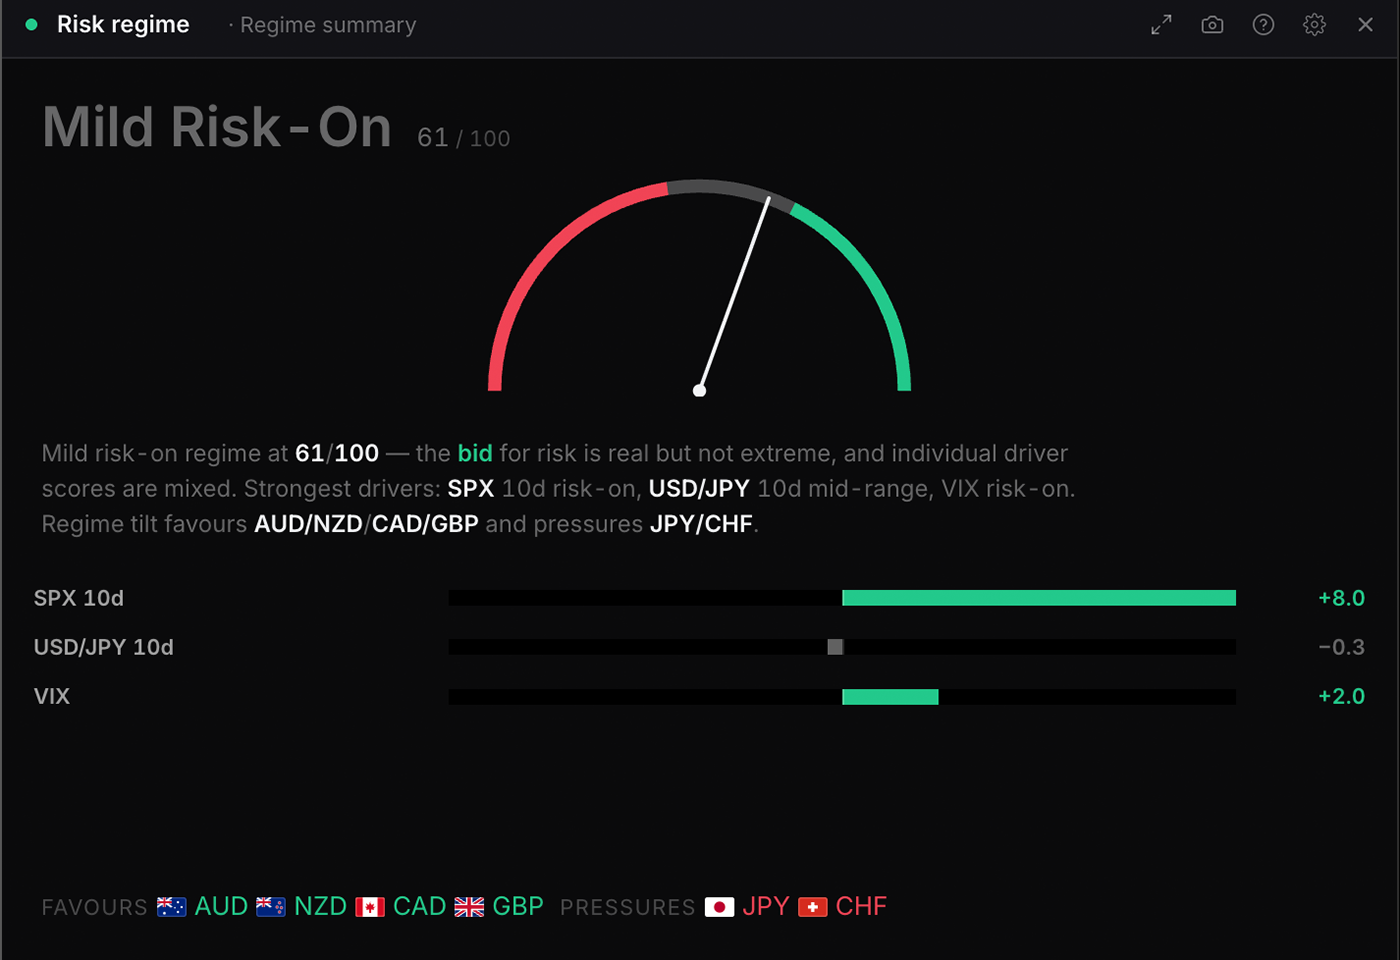
Risk regime
risk_gauge
Free
The risk-on and risk-off model: the composite gauge, the signals feeding it, and how much each one contributes. Model-driven, so it can disagree with price. For the same question read from price action alone, use Market regime.
Settings
Visualisation
Regime summarydefault
Signal contributions
Table
Density
Compact shows the three heaviest signals. The narrative is never cut.
Compactdefault
Every signal
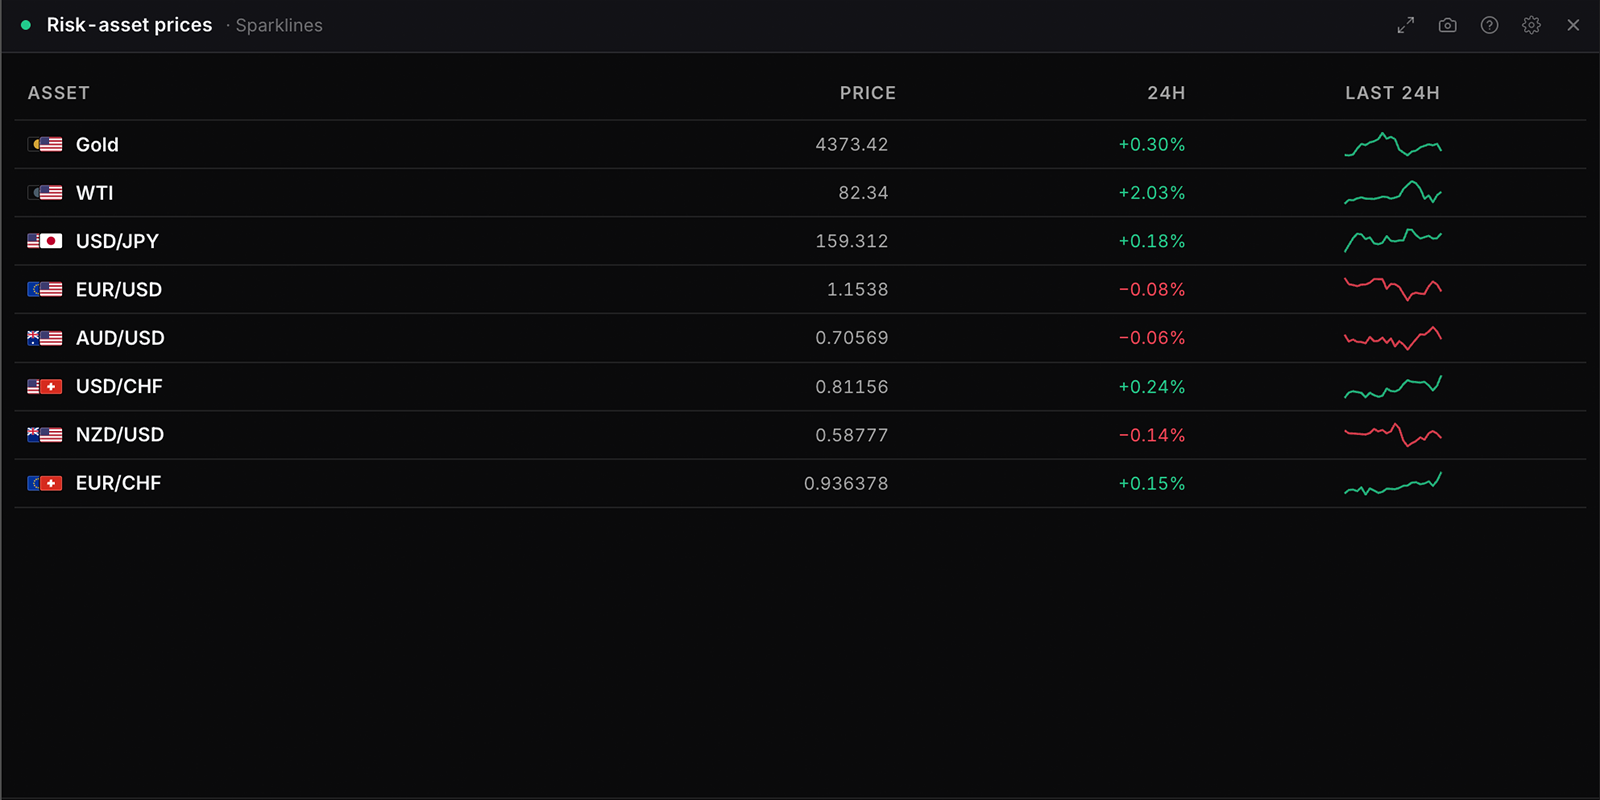
Risk-asset prices
risk_prices
Free
Live prices for the assets used as risk proxies, with the 24-hour change and recent path for each. These are the inputs behind the risk regime reading, shown raw so you can see what is driving it.
Settings
Visualisation
Prices needs one request. The other three read 24 hours of
Pricesdefault
Sparklines
24h change heatmap
Winners and losers
Assets
Choices are built from whatever the data currently
covers, so the list changes with the markets on the board.
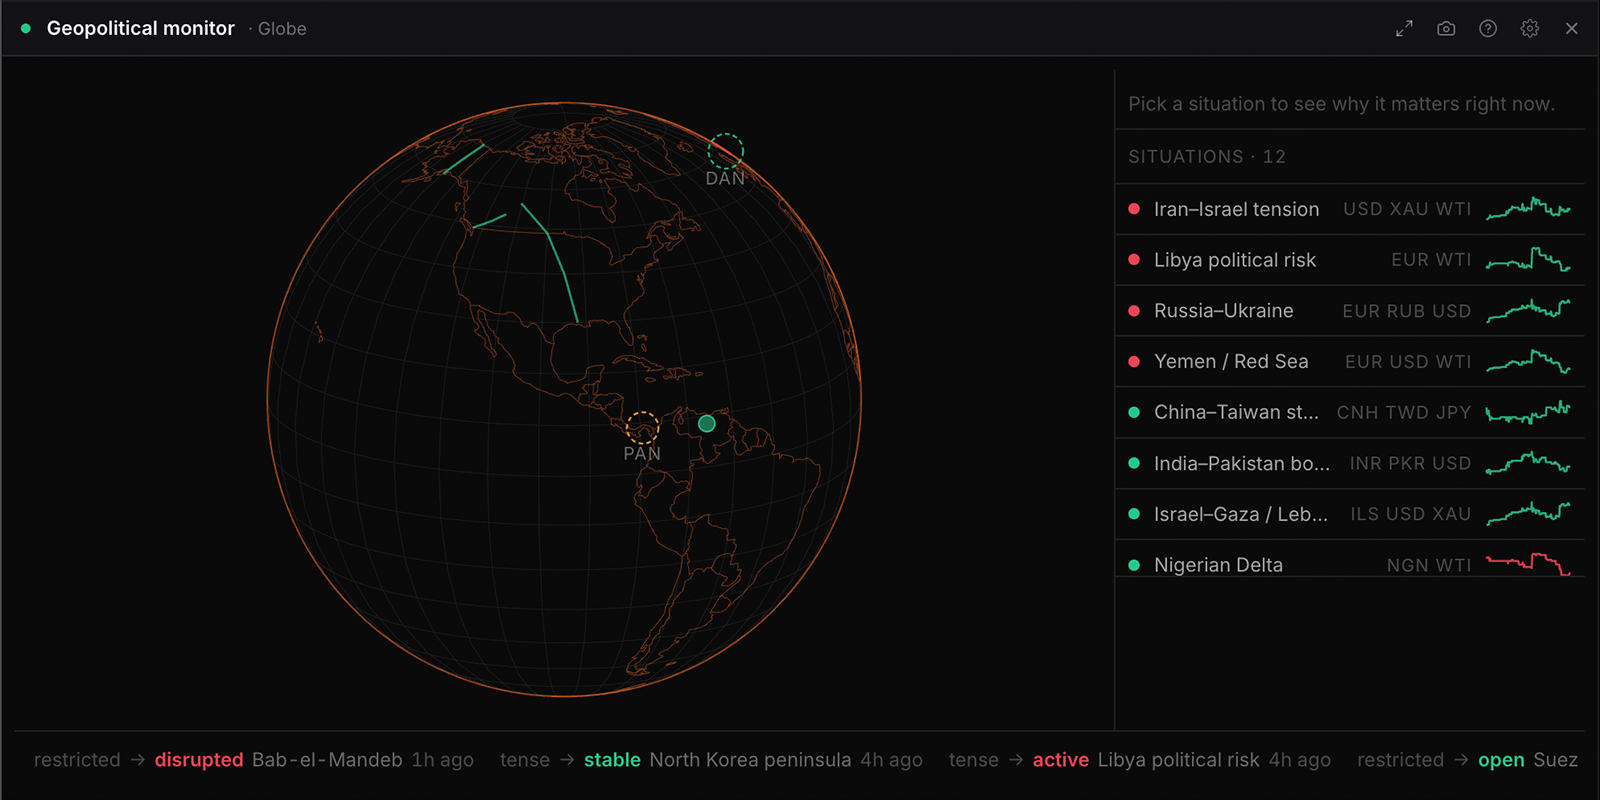
Geopolitical monitor
situation_monitor
Pro
Active geopolitical situations on a rotating globe, a flat map, or as a list. Clicking a situation opens it in place rather than navigating away from the board.
Settings
Visualisation
Escalation basket collects what each situation implies if it worsens,
Globedefault
Flat map
Active situations
By region
Escalation basket
Show
Everything watcheddefault
Active only
Closest watched
Context
Showdefault
Hide
Side panel
Showdefault
Hide
Recent changes
A strip of the latest escalations and de-escalations.
Showdefault
Hide
Map layers
Tanker routes are the densest layer and are best turned on
Chokepoints
Pipelines
Production regions
Tanker routes
Situation history
Loads the event log for whichever situation is selected.
Showdefault
Hide
Drift
The globe pauses while the pointer is over it and resumes when it leaves.
Slow turndefault
Hold still
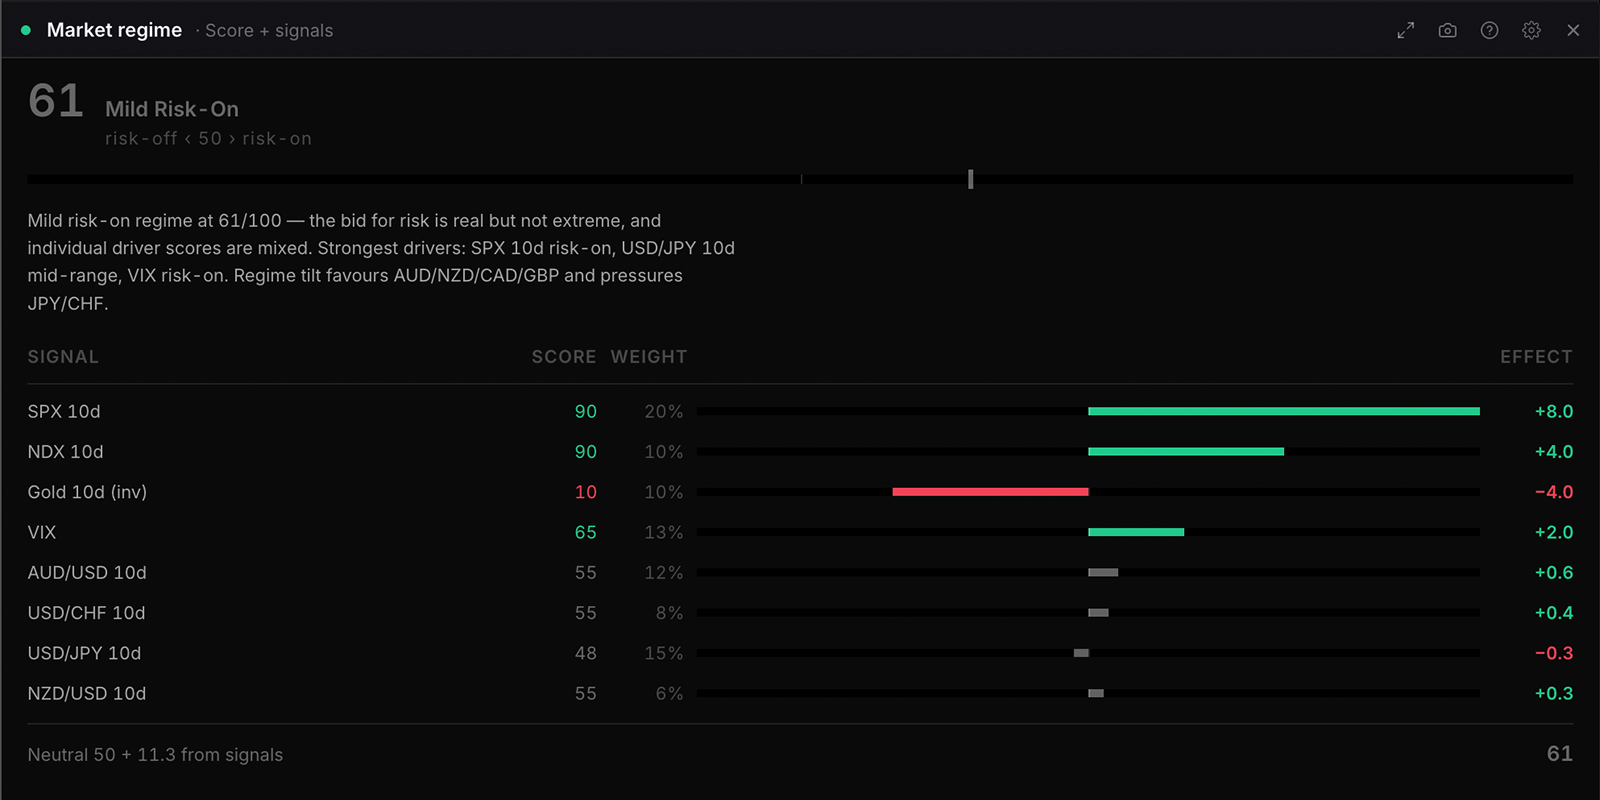
Market regime
market_regime
Free
Where the market sits right now, read purely from price action: risk assets against havens, the dollar strengthening, weakening or ranging, and volatility calm, normal or stressed against its own baseline. For the model-driven composite instead, use Risk regime.
Settings
Visualisation
Headline only suits a small tile; signals only suits a tall narrow one.
Score + signalsdefault
Signals only
Headline only
Sort by
Strongest effectdefault
Weight
Name
Narrative
The written read on the current regime.
Showdefault
Hide
Signal detail shown when view is dial or signals
Weight and effectdefault
Score only
Scores & bias
10 widgets
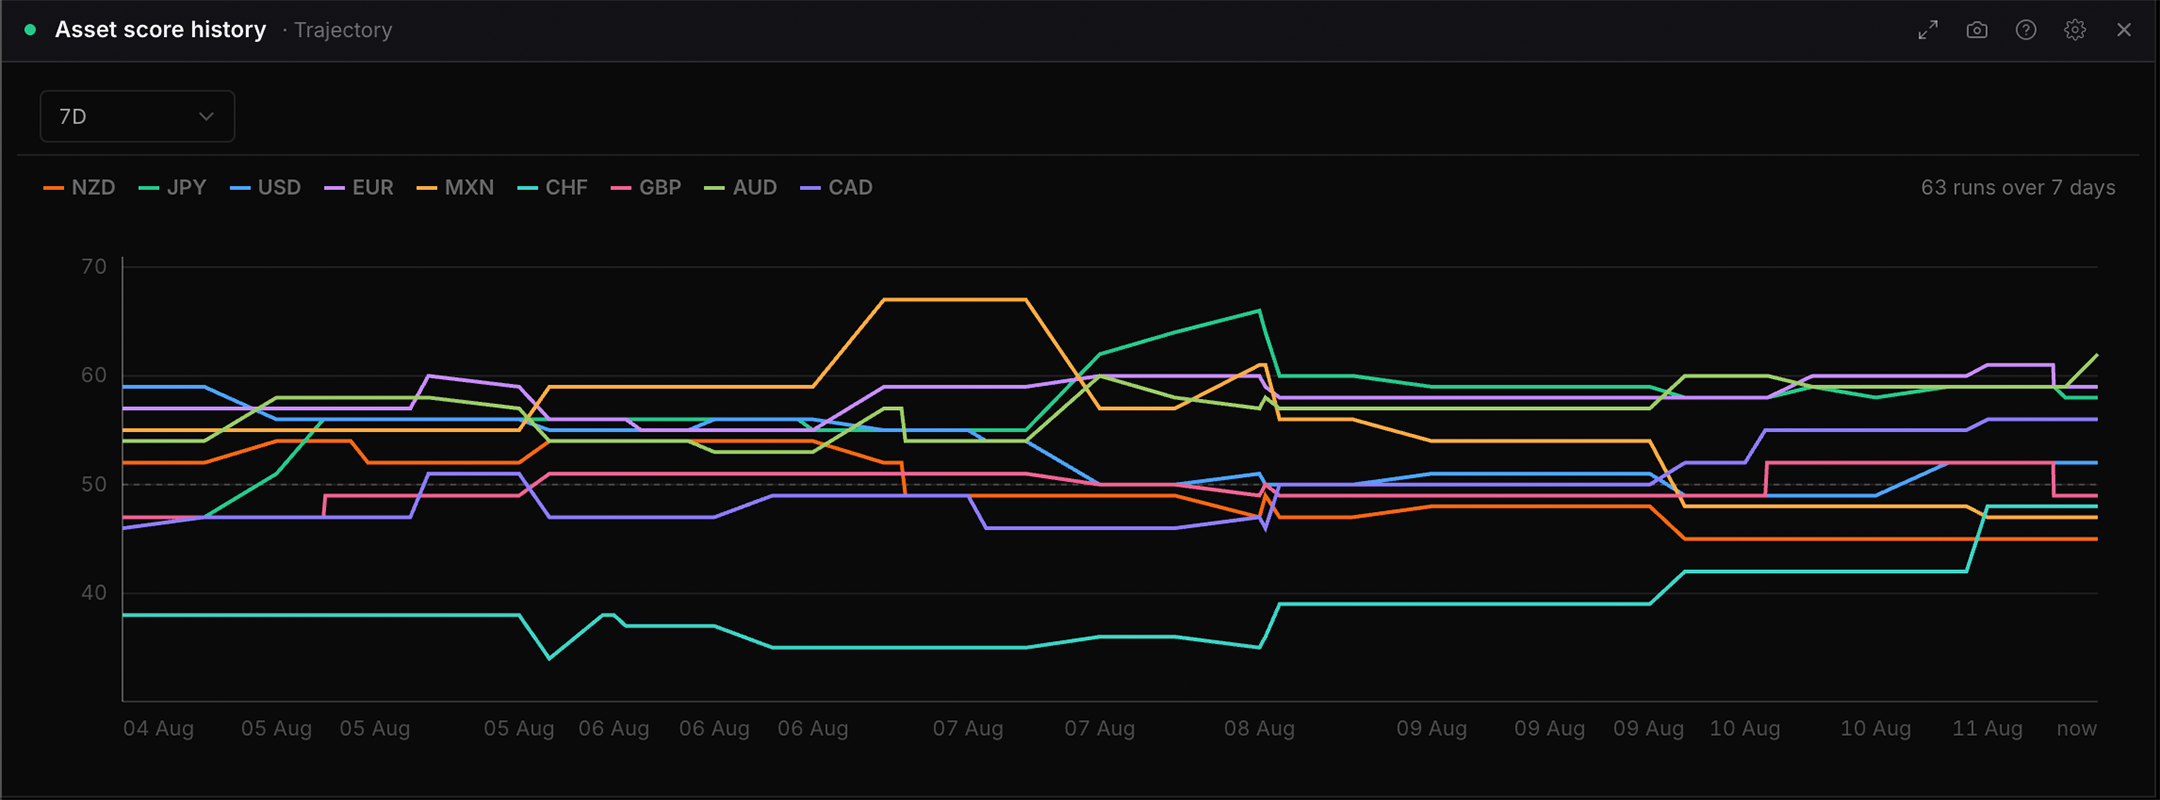
Asset score history
score_history
Free
Composite score trajectory across the recorded history for the assets you select, with the net change over the chosen window. Shows where a bias has been drifting rather than where price has been.
Settings
Visualisation
Overlay as many as you like; the legend toggles each one.
Choices are built from whatever the data currently
covers, so the list changes with the markets on the board.
Visualisation
Trajectorydefault
Change over window
Table
Chart controls
Window buttons above the plot. Turn off for a bare chart on a dense board.
On the chartdefault
Settings only
Window
Measured in days. Only windows the recorded history can fill are offered.
Choices are built from whatever the data currently
covers, so the list changes with the markets on the board.
Flags
Showdefault
Hide
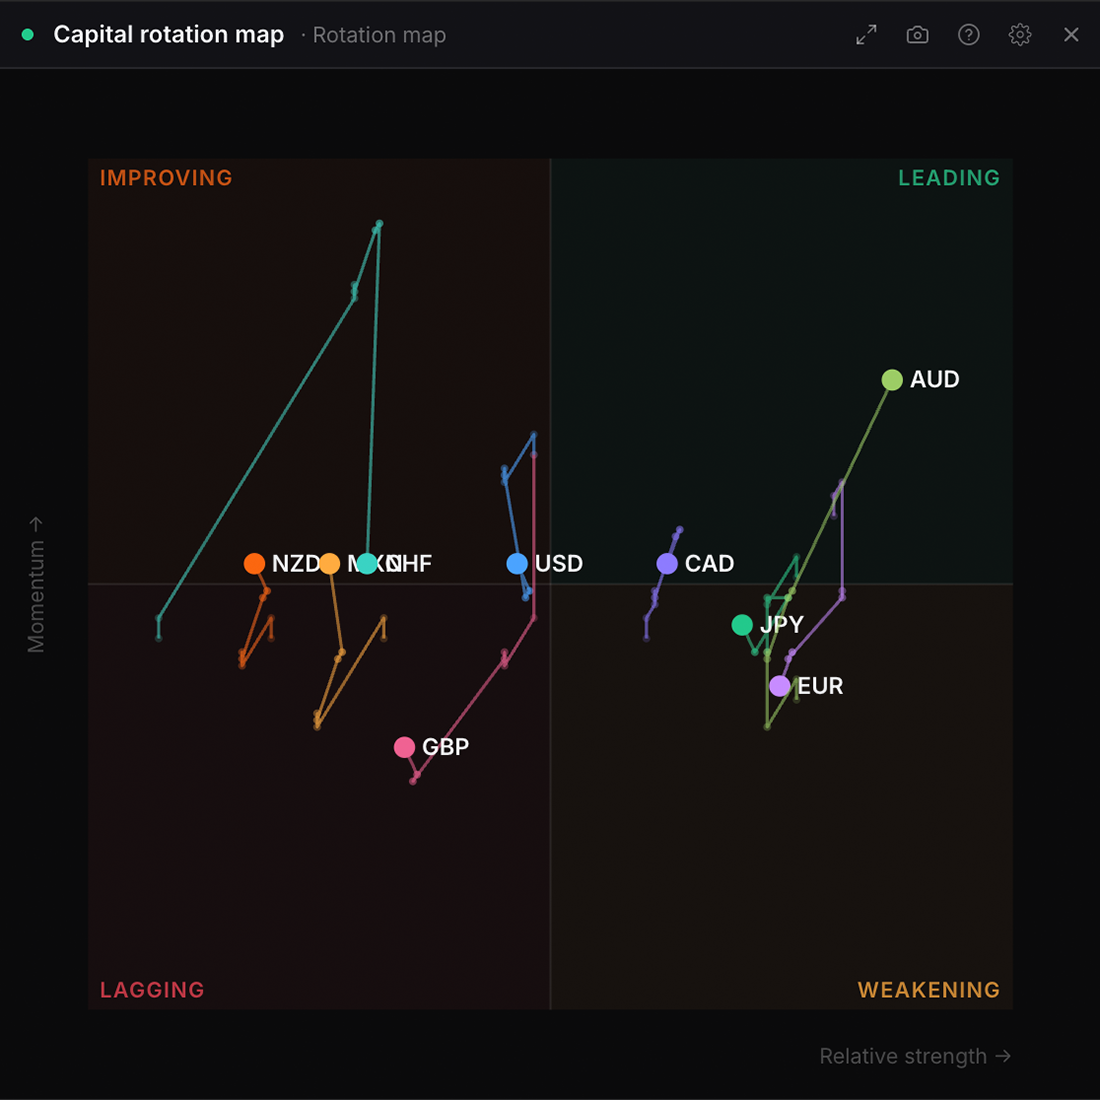
Capital rotation map
rotation_map
Free
A Relative Rotation Graph: each asset plotted by relative strength across the horizontal and the momentum of that strength up the vertical, with a tail tracing its path through the Leading, Weakening, Lagging and Improving quadrants. Choose which assets to plot. The tail is measured in scoring runs rather than days, because the runs are dated but not evenly spaced.
Settings
Tail length
Measured in scoring runs, not days. The runs are dated but not evenly spaced, so one run is not a fixed amount of time.
Choices are built from whatever the data currently
covers, so the list changes with the markets on the board.
Tail length
Measured in scoring runs, not days. The runs are dated but not evenly spaced, so one run is not a fixed amount of time.
5 runs
8 runsdefault
12 runs
16 runs
Momentum window
How far back each point looks to measure whether relative strength is building or fading.
3 runs
5 runsdefault
10 runs
Visualisation
Rotation mapdefault
Table
Conviction ranks
conviction_ranks
Free
Currencies ranked by how far the composite sits from neutral, in either direction. A high reading means the engine holds a side with confidence; it says nothing about how far the market will travel.
Settings
Visualisation
Ranked rows put the strongest lean at the top whichever way it points. Diverging bars show direction and size in one shape. Split by side lists bulls and bears separately.
Choices are built from whatever the data currently
covers, so the list changes with the markets on the board.
Visualisation
Ranked rows put the strongest lean at the top whichever way it points. Diverging bars show direction and size in one shape. Split by side lists bulls and bears separately.
Ranked rowsdefault
Diverging bars
Split by side
Minimum distance
Conviction here is distance from neutral, not confidence that the move will work. A high number means the inputs agree, nothing more.
Show everythingdefault
5 points from neutral
10 points from neutral
Currency anatomy
currency_anatomy
Free
Driver anatomy for one currency: the live scored drivers (rates, fundamentals, bank research, positioning, seasonality, risk flow) shown as tailwind/headwind spokes around the currency, plus a curated structural context strip. Full view adds a per-driver detail dossier (every indicator, the actual bank calls, the central-bank reasoning).
Settings
Currency
Choices are built from whatever the data currently
covers, so the list changes with the markets on the board.
Visualisation
Driver mapdefault
Contribution
Driver scores
Score history
Table
Structure strip
Standing structural facts about the currency: energy balance, export mix, trade partners. Reference data, not live.
Showdefault
Hide
Sort by
By effectdefault
By weight
By name
Research desk
research_desk
Free
One asset read end to end: what the composite is made of, what the research desk has written on it, and the central bank that sets its rate. Currencies, metals and indices; a cross is what Pair focus is for.
Settings
Asset
The desk writes on one asset at a time, currencies as well as metals and indices. A cross is what Pair focus is for.
Choices are built from whatever the data currently
covers, so the list changes with the markets on the board.
Score breakdown
Showdefault
Hide
Written research
Showdefault
Hide
Central bank
The rate setter, the current rate and the next decision. Only currencies have one, so this block is absent for a metal or an index.
Showdefault
Hide
Flags
Showdefault
Hide
Asset scores
g8_table
Free
Every monitored asset with its composite score and bias, from a quick scan down to a table that opens every driver behind each score side by side, with the seasonal window and the move since the last run.
Settings
Visualisation
Rows show a bias bar per asset. Grid suits wide, short panels. Dense list fits the most assets in the least height. Detailed opens every driver behind the score.
Choices are built from whatever the data currently
covers, so the list changes with the markets on the board.
Visualisation
Rows show a bias bar per asset. Grid suits wide, short panels. Dense list fits the most assets in the least height. Detailed opens every driver behind the score.
Ranked rowsdefault
Card grid
Dense list
Detailed table
Group by class
Splits currencies, metals and indices under their own headings.
One listdefault
Separate sections
Flags
Showdefault
Hide
Bias label
Showdefault
Hide
Show bias
Filter to only the assets currently reading one way.
Bullish
Neutral
Bearish
Sort by
Strongest firstdefault
Weakest first
Code A\u2013Z
Bias
Attribution
The driver breakdown that explains each score.
On clickdefault
Always open
Hidden
Density
Comfortabledefault
Compact
Research snaps shown when attr is click or always
The written take for each asset, shown above its drivers.
Yesdefault
No
Driver matrix
driver_matrix
Free
Every driver against every currency in one grid: fundamentals, bank research desk by desk, positioning, central bank and seasonality, with the composite pinned on top. Groups open in place rather than filtering the others away, so you can hold two open at once. Click a currency to open its board. FX only, because bank research and central-bank stance are thin on metals and indices and a blank cell reads as a missing feature rather than an absent market.
Settings
Expanded groups
Which groups open on load. Any group can be opened or closed on the grid itself; this is only the starting state.
Fundamentals
Bank research
Positioning
Seasonality
Neutral cells
Fading neutral leaves only the readings that lean, which is what a scan is for. Showing every one is better when you want to check a specific cell rather than find the outliers.
Show every reading
Fade the neutral onesdefault
Currency snapshot card
currency_card
Free
One currency at a glance: its composite score and bias, the contribution of each driver behind it, central bank stance and COT positioning. Opens up to the written read, the themes and geopolitical risks attached to it, and a per-indicator breakdown of the fundamentals and the bank calls underneath.
Settings
Currency
Choices are built from whatever the data currently
covers, so the list changes with the markets on the board.
Visualisation
Full carddefault
Compact
Positioning
Speculative positioning from the weekly futures report, which is published with a lag.
Showdefault
Hide
Score-shift log
score_shift_log
Free
What has moved and by how much, in change-log form, ranked by the size of the shift and measured in scoring runs rather than days. Moves that cross the neutral line are called out, since those are the ones that flip a bias.
Settings
Compared with
Counted in scoring runs rather than days. The runs are dated but not evenly spaced, so one run is not a fixed amount of time.
Choices are built from whatever the data currently
covers, so the list changes with the markets on the board.
Compared with
Counted in scoring runs rather than days. The runs are dated but not evenly spaced, so one run is not a fixed amount of time.
The previous rundefault
5 runs ago
10 runs ago
Minimum move
Every movedefault
1 point or more
3 points or more
Unchanged assets
Hidedefault
Show
Weekly score movers
top_movers
Free
The currencies whose composite score moved most over the past week, ranked by the size of that move. Score movement, not price movement: a currency can top this list on a week when its price barely moved.
Settings
Visualisation
All views rank by the same weekly change; only the encoding differs.
Choices are built from whatever the data currently
covers, so the list changes with the markets on the board.
Visualisation
All views rank by the same weekly change; only the encoding differs.
Rows with trenddefault
Ranked bars
Columns
Heatmap
Table
Direction
Biggest moves ranks by size of change regardless of direction.
Biggest movesdefault
Gainers only
Losers only
Show
Top 5
Top 10default
All
Trend line
Score path across the last 30 scoring runs.
Showdefault
Hide
Flags
Showdefault
Hide
Density
Comfortabledefault
Compact
Squawk
1 widgets
Squawk chat
chat_room
Free
Live channel discussion from Squawk: post, reply and react without leaving the board. New messages arrive over a live connection rather than on a refresh timer. Use “Open chat” for the pop-out.
Settings
Channel
Channels are set by the desk.
Choices are built from whatever the data currently
covers, so the list changes with the markets on the board.
History
The server holds the most recent 100 messages of the last 180 days.
Last 25
Last 50default
Everything held
Channel strip
Hide it to give the messages more room when the panel only ever reads one channel.
Showdefault
Hide
Density
Roomydefault
Tight
Utility
3 widgets
Data freshness
data_freshness
Free
How recently each underlying data feed was refreshed, colour-coded by staleness. Tells you whether a quiet widget is quiet because the market is quiet or because its source has stopped updating.
Settings
Density
Each feed is graded against its own refresh cadence, so a weekly source is not marked stale for being a few days old.
Compactdefault
Expanded (absolute times, grouped)
FX market status
market_status
Free
Whether the FX market is open right now, with the time remaining until the next open or close. The week runs from roughly 21:00 Sunday to 21:00 Friday UTC.
Settings
Density
The week runs from Sunday 17:00 to Friday 17:00 New York time, so the UTC boundary shifts with daylight saving.
Compactdefault
Expanded (adds countdown)
Session clock
session_clock
Free
Live clocks for the four FX sessions, Sydney, Tokyo, London and New York, with whether each is open or closed and how long until that changes.
Settings
Density
Session hours are each centre\u2019s local time, so daylight saving is applied automatically in both hemispheres.
Compactdefault
Expanded (adds countdown)
Read the real thing
86 of these are free, with no card.
2 complete boards you build yourself, covering
scores on 24 markets, positioning across 44, and the
research behind them. Pro is $49 a month and lifts the limit.