Correlation answers one question: are these two bets, or one bet twice?
Every tool offers a grid of price correlations. WatchTower carries three: across prices, across how speculators are positioned, and across the positions you actually hold. Only the last one answers the question a trader is really asking, and it comes with volatility beside it, because a correlation without a magnitude is half a picture.
Three correlations
Same measure, three different questions.
Price correlation
Do these two markets move together?
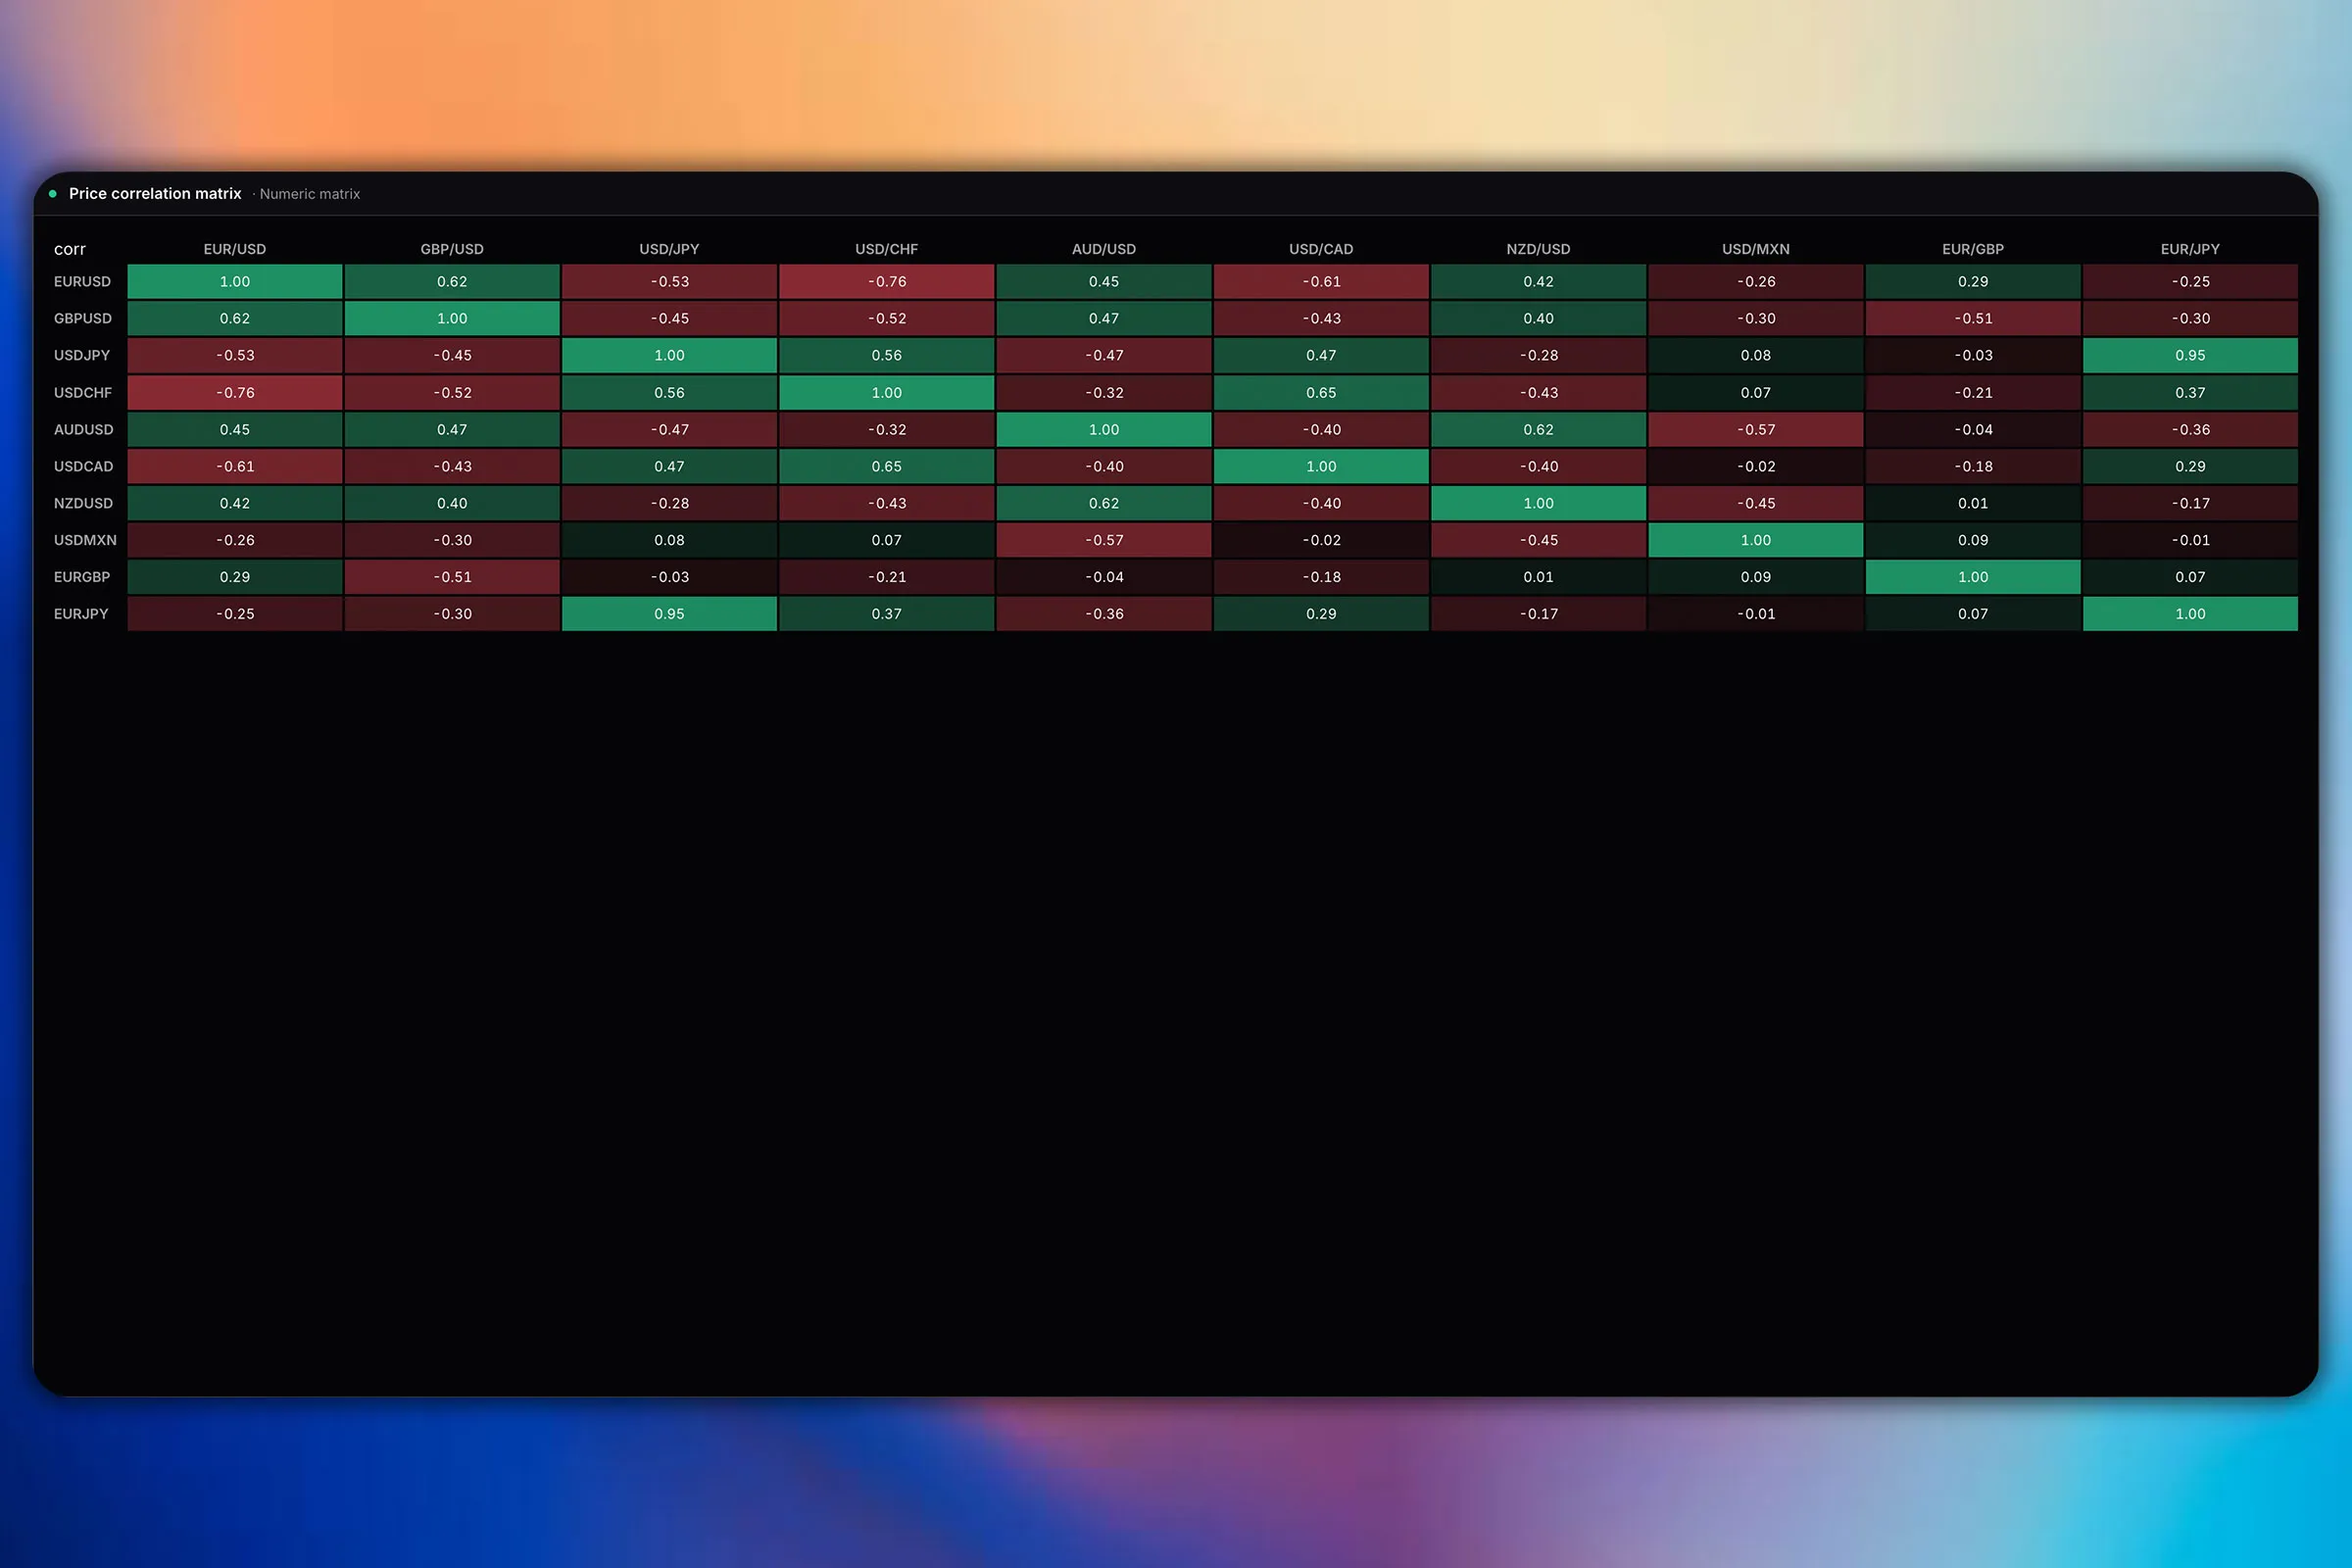
Rolling correlation of daily returns across the instruments you choose. The standard reading, and the one every tool offers.
Positioning correlation
Is the whole complex being traded as one bet?
A 26-week rolling correlation between COT positioning changes across currencies. When positioning moves together across the board, the market is expressing one macro view in several tickets, which price correlation alone will not show you.
Portfolio correlation
Are my positions two bets or one?
The same measure applied to what you actually hold. This is the only version that answers the question a trader is really asking, and it is the one a screener cannot give you because it does not know your book.
Being straight about it
Correlation breaks exactly when you need it.
A correlation figure describes a window, not a property of a pair. Two markets can move together for six months and separate in the week it matters. And correlations tend to rise in a crisis, which is precisely when a book built to be diversified is supposed to be protecting you, so the number is least reliable at the moment it is most load-bearing.
The practical use is not the coefficient. It is noticing that two positions you thought were separate have been moving as one, and deciding whether that was intended.
Depth
A grid, or an answer about your book.
The panels
Six boards.
- Price correlation matrix. Rolling correlation of daily returns across the instruments you select, over the window you choose rather than a fixed one.
- COT correlation matrix. A 26-week rolling correlation between positioning changes across currencies, which shows when the board is being traded as a single macro bet.
- Portfolio correlation. Whether the positions you hold move as one, correlated on the daily returns of your actual book.
- Volatility ranking. Realised volatility and average daily range across the markets you select, ranked, because a correlation without a magnitude is half a picture.
- Asset statistics. The statistical profile of any market: historical volatility and return percentiles, which is the context that says whether today move is large or ordinary.
- Capital rotation map. Each market plotted by relative strength and momentum, so rotation between them is visible as it happens rather than inferred afterwards.
Correlation, answered.
Why does currency correlation matter?
For one reason: it decides whether two positions are two bets or one. A book holding several highly correlated positions has the risk of a single large position, not several small ones, and it will win together or lose together regardless of how diversified the ticket list looks.
How stable is correlation?
Not very, and this is the part worth knowing before relying on a grid. Two markets can correlate tightly for six months and separate the month it matters. Worse, correlations tend to rise in a crisis, which is exactly when a diversified book is supposed to be protecting you. A correlation figure is a description of a window, not a property of the pair.
What window should I use?
Whichever matches the horizon you trade, which is why the window is yours to set rather than fixed. A short window is responsive and noisy; a long one is stable and slow to notice a regime change. Reading two windows and noticing they disagree is usually more informative than picking one.
What is positioning correlation?
The same measure applied to how speculative positioning is changing rather than to price. When positioning moves together across many currencies, the market is putting on one macro view in several places, and that is a different signal from prices happening to move together.
Why is volatility on this page?
Because a correlation on its own has no magnitude. Two markets correlated at 0.8 where one moves twice as far as the other are not equally weighted contributors to your risk, and average daily range is what turns a coefficient into something you can size against.
Is it free?
The free plan carries 32 of the 103 panels across 2 boards, and which ones is listed on the pricing page. Everything else is on Pro at $49 a month.