How to Read the COT Report (Without Fooling Yourself)
A plain-language guide to the CFTC Commitments of Traders report: who is in it, what the net position actually tells you, and the traps that catch most traders.
The Commitments of Traders report is one of the few genuinely free windows into how large players are positioned in futures. It is also one of the most misread reports in the market. People see a big speculative long, call the top, and get run over for another three weeks. I want to walk through how I actually read it, and where the traps are.
What the COT report actually is
Every week the U.S. Commodity Futures Trading Commission publishes a breakdown of open positions in the futures markets it regulates. That includes the currency futures listed on the CME, gold and silver, oil, and the equity index futures. The report comes out on Friday at around 3:30pm Eastern, and it reflects positions as of the close on the previous Tuesday.
Read that last part again, because it is the first trap. By the time you see the data on Friday, it is already three days old. In a fast week the picture can have changed completely before the report even lands.
Who is actually in the report
The classic version of the report, the legacy format, splits everyone into three buckets.
- Commercials. These are the hedgers, the companies and institutions using futures to offset a real underlying exposure. In FX this group matters less for a directional read, because they are trading for reasons that have nothing to do with a view on price.
- Non-commercials. These are the large speculators, mostly funds. This is the group most traders watch, because these are participants taking a position because they expect the market to move.
- Non-reportables. The small traders whose positions sit below the reporting threshold. Often treated, fairly or not, as the least informed money in the market.
For currencies there is a more useful breakdown called the Traders in Financial Futures report, which separates the speculative side into asset managers and leveraged funds. Asset managers tend to move slowly and hold longer. Leveraged funds are the faster, more tactical money. When those two groups agree, the positioning signal is stronger. When they disagree, that tension is itself worth noting.
The number that matters is the change, not the level
Most people fixate on the net position, which is simply the longs minus the shorts for a given group. A large net long in the euro, for example, tells you speculators are leaning bullish.

On its own, that level is close to useless. Positioning can sit stretched for months. What I care about far more is the change week to week, and where the current reading sits relative to its own recent history. A one-week swing from modestly short to heavily long tells me sentiment is shifting fast. A net long that has quietly sat near a multi-year extreme tells me the trade is crowded and the fuel to push it further may be running low.
This is why I look at COT as a range, not a single print. The same net long number means one thing near the bottom of its yearly range and something completely different near the top.
Reading an extreme
The most common way traders use COT is as a contrarian tool. The logic is reasonable. When almost everyone who wants to be long is already long, there is little buying power left to push price higher, and any bad news forces a rush for the exits. Positioning extremes mark the points where a market is most vulnerable to a sharp reversal.

The problem is timing. An extreme tells you the market is fragile. It does not tell you when it breaks. Crowded positioning can become more crowded, and a market can stay stretched far longer than looks reasonable. I treat a positioning extreme as a warning that raises my caution, and never as a standalone entry signal.
The traps that catch people
Three things trip up most traders reading this report.
The lag. As above, the data is three days stale on release and a full week stale by the following Thursday. Treat it as a slow-moving backdrop, not a live feed.
Futures are a slice, not the market. The spot FX market is enormous and mostly traded over the counter, well outside anything the CFTC sees. Currency futures are a real and useful sample of speculative flow, and they are still only a sample. Do not mistake the futures picture for the entire market.
Crowded is not the same as wrong. A consensus long can be the correct trade for a long time. Positioning tells you about risk and fragility. It does not overrule the underlying macro driver.
How I use it in practice
I never trade COT in isolation. I use it as one layer of corroboration. If the macro case for a currency is bullish, research consensus leans the same way, and positioning is still light rather than stretched, that is a far cleaner setup than the same macro case with the whole speculative crowd already piled in. When positioning sits at an extreme against my thesis, I size down and pay attention.
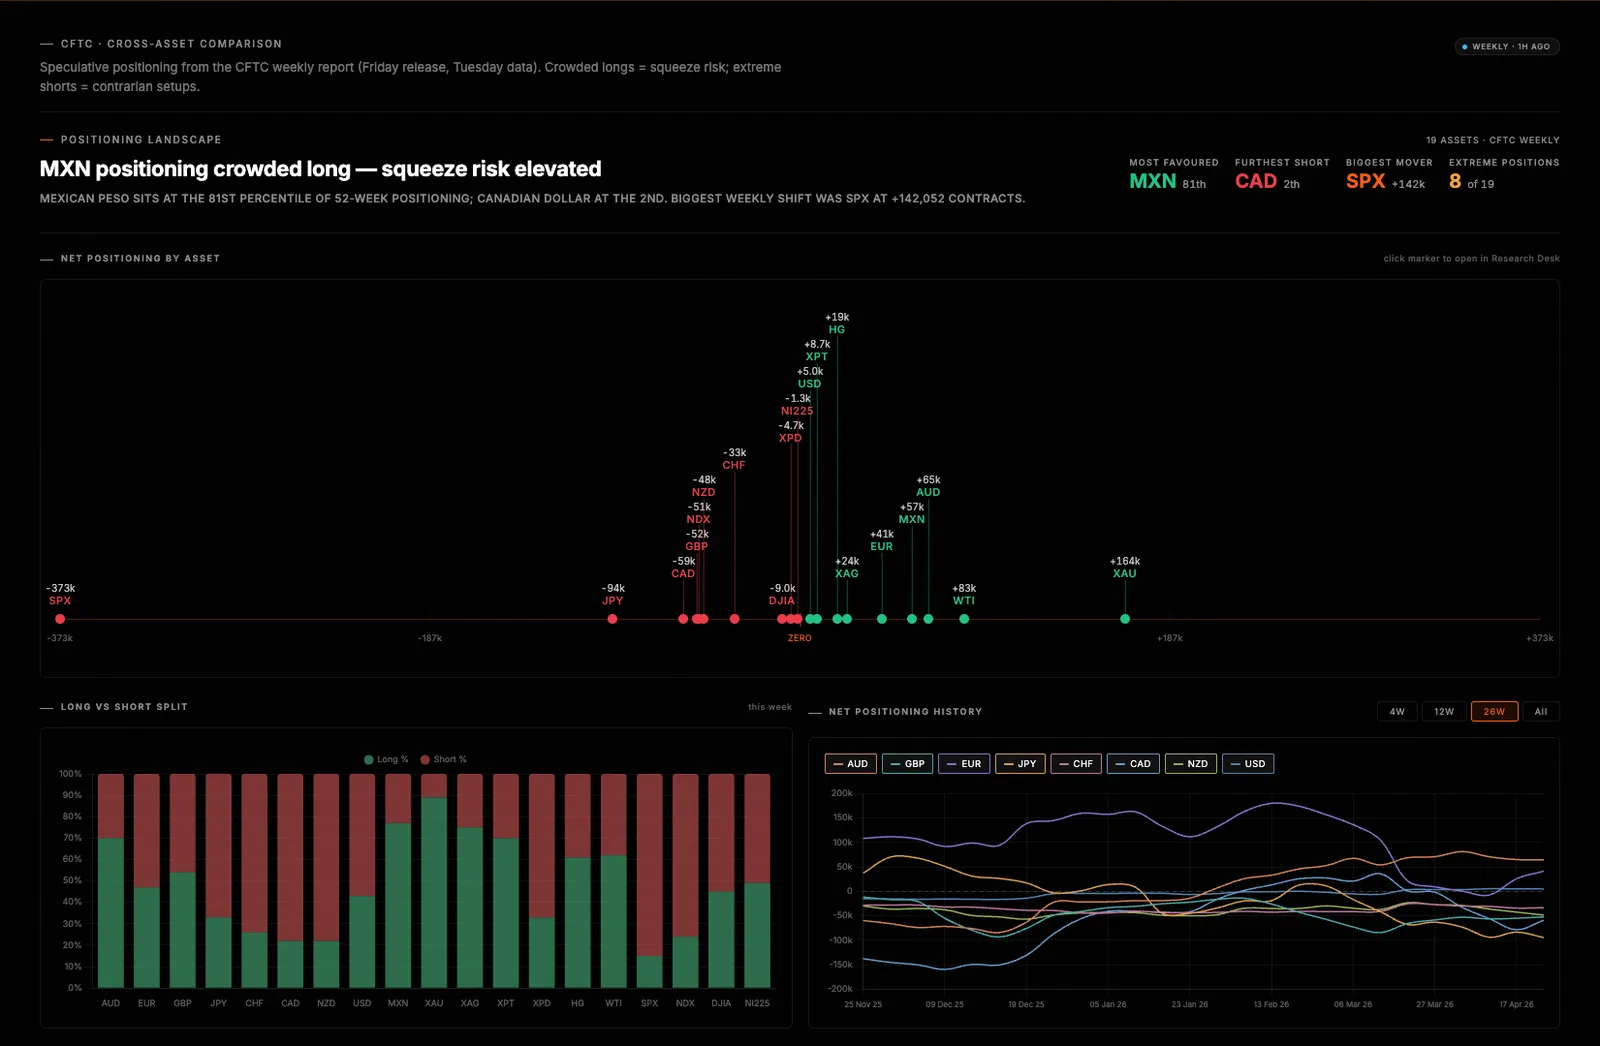
In WatchTower Terminal I read positioning as a net figure alongside its recent range and its week-over-week change, next to the research consensus and the macro score for the same asset, so the corroboration is in one view rather than four browser tabs. That is the whole point of reading it this way. The COT report is a good witness. It is a poor judge, and it should never be the only voice in the room.
If you want the other side of the corroboration, the companion piece on reading bank research consensus covers where the institutional crowd actually leans.
Read the market the way this page describes.
WatchTower Terminal turns bank research, positioning and central-bank data into one clear read across FX, metals and global indices. Start free, no card required.