Documentation · Market data · Pro
Seasonality
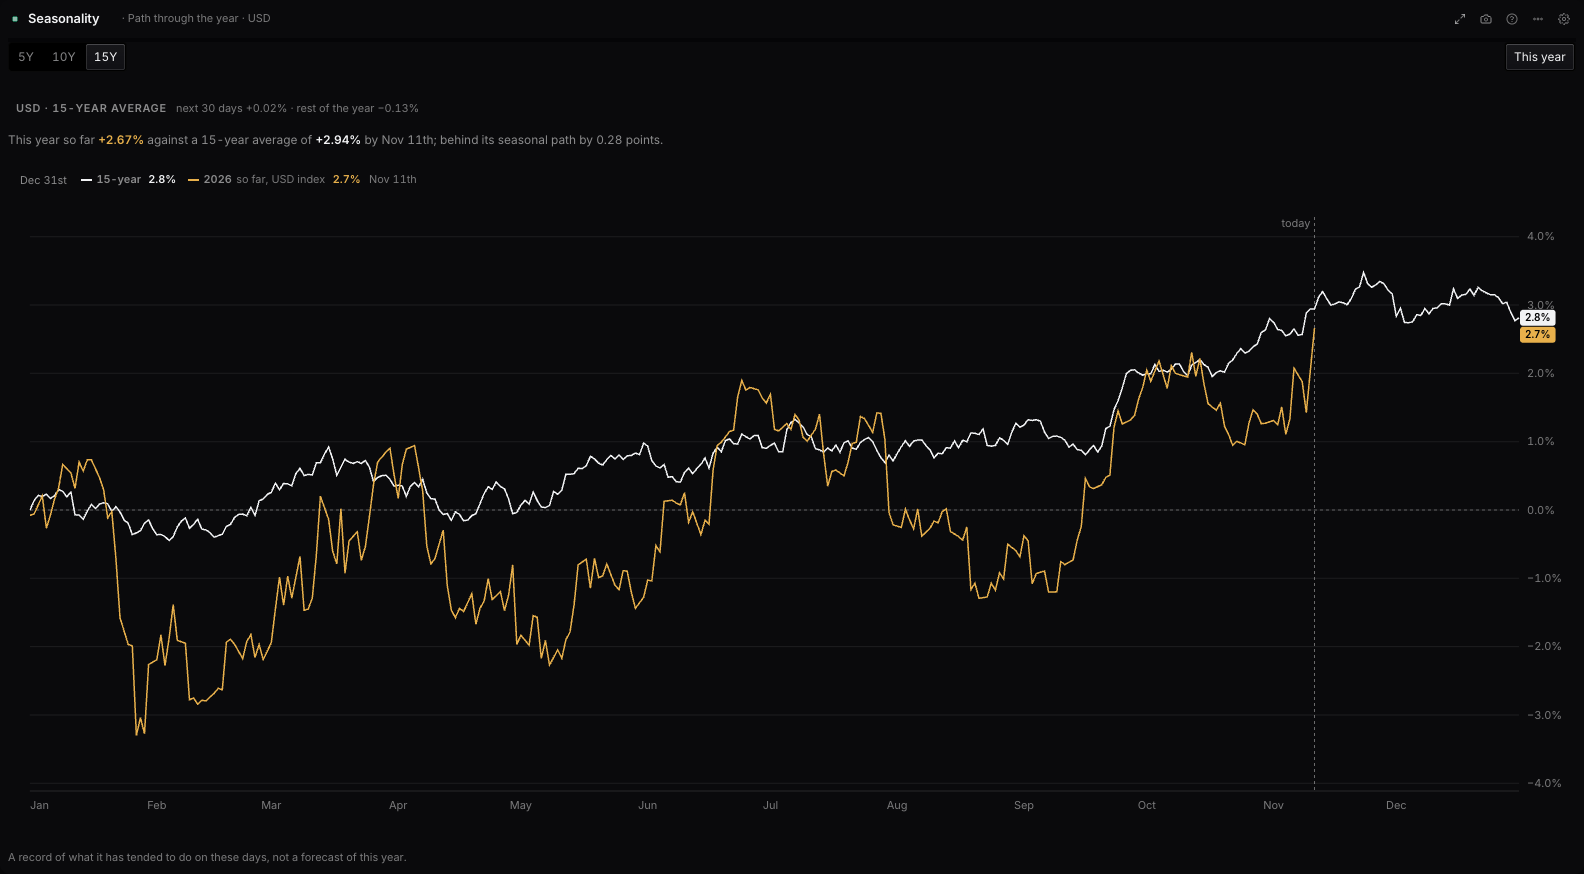
The Seasonality panel in WatchTower Terminal: what any asset has tended to do on these calendar days in past years: the path through the year over 5, 10 and 15 years, the path ahead from today and on the asset's own candles, each month's average, and every asset over the weeks ahead. It is on the Pro plan, and it is built on each market's own price history, month by month.
What it shows
What any asset has tended to do on these calendar days in past years: the path through the year over 5, 10 and 15 years, the path ahead from today and on the asset's own candles, each month's average, and every asset over the weeks ahead. A record of a tendency, not a forecast.
Its reads
- Path through the year
- Ahead from today
- On price
- By month
- Across assets
The data
- Where it comes from
- Each market's own price history, month by month.
- How often it updates
- At each month end.
- In the score
- Seasonality carries 13.5% of each currency's composite score.
- Plan
- Pro
Settings
| Setting | What it does | Choices |
|---|---|---|
| Read | The year’s path; the path ahead from today; that path on the asset’s candles; each month’s average; or every asset over the weeks ahead. | Path through the year, Ahead from today, On price, By month, Across assets |
| Asset | — | Filled from the data |
| Against | Builds a pair, e.g. EUR against USD gives EUR/USD. | Nothing (single asset) |
| Years of history | Overlay shorter windows to see whether the pattern holds or is a one-regime artefact. In the table each window gets its own columns. | 15 year, 10 year, 5 year |
| This year | The asset’s own move since the start of this year, day for day, over its seasonal path. A single currency is read from its WatchTower index. | Drawn over the averages, Off |
| Horizon | — | 7 days, 14 days, 30 days, 60 days |
| Candles | Four-hour is the timeframe the price feed is known to serve for every symbol. Daily and weekly come from a separate end-of-day feed which does not cover every instrument. | 4 hour, Daily, Weekly |
| Chart controls | — | On the chart, Settings only |
Questions
What does the Seasonality panel show?
What any asset has tended to do on these calendar days in past years: the path through the year over 5, 10 and 15 years, the path ahead from today and on the asset's own candles, each month's average, and every asset over the weeks ahead. A record of a tendency, not a forecast.
Where does Seasonality's data come from, and how often does it update?
Each market's own price history, month by month. At each month end.
Is Seasonality free?
Seasonality is on the Pro plan: $10 for the first month, then $49 a month, or $490 a year.
Does Seasonality feed the composite score?
Seasonality carries 13.5% of each currency's composite score.
Free on this site: Forex seasonality
Also in Market data: Asset statistics · Live prices · Currency strength index · Index breakdown · Price chart
WatchTower Terminal has 50 panels; this page documents one. Nothing here is financial advice.