Documentation · Market data · every plan
Price chart
The Price chart panel in WatchTower Terminal: watchTower native chart. It is on every plan, and it is built on prices from a licensed market data feed, with the terminal's own levels and data drawn on.
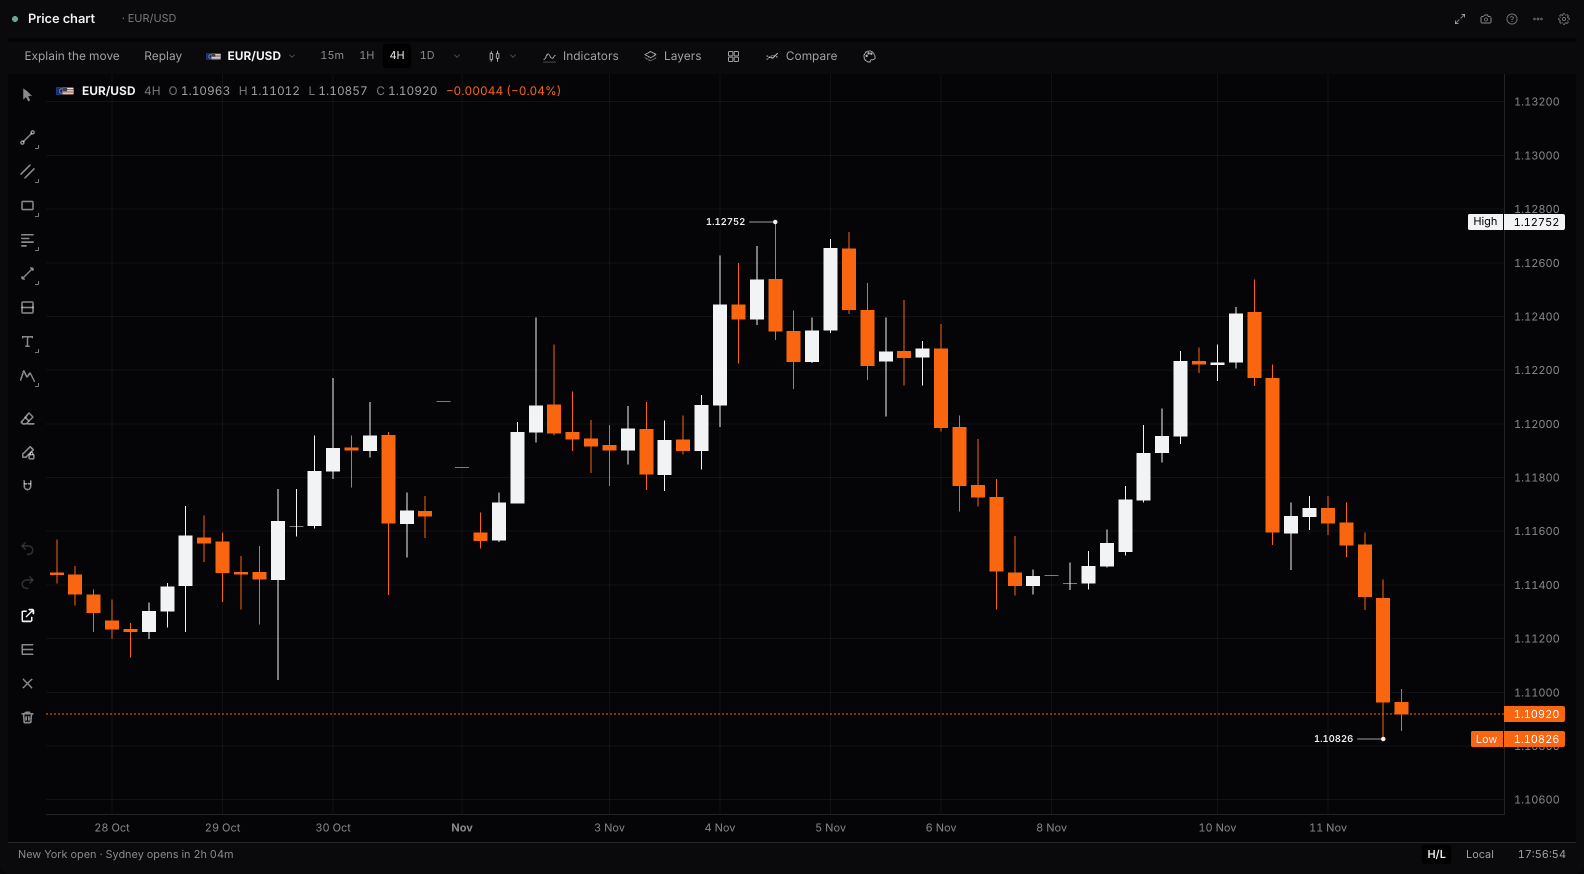
What it shows
WatchTower native chart. 44 assets: FX, metals, commodities, indices. Candles, area or line, across 5m to 1M timeframes. Explain the move reads what carried the move on screen; Replay plays any market forward from a moment in the last year, as the terminal knew it then: the releases as they landed, the wire as it was graded, and the scores and pricing at the close before.
The data
- Where it comes from
- Prices from a licensed market data feed, with the terminal's own levels and data drawn on.
- How often it updates
- Live.
- Plan
- Every plan
Settings
| Setting | What it does | Choices |
|---|---|---|
| Asset | The market the panel opens on, currency indices included. Everything else is on the chart itself: the timeframe, up to sixteen charts in one panel and how they keep in step, indicators, drawing tools, alerts on a level, the magnifier and the object tree. Right-click the chart for a level or an alert at that price. | EUR/USD, GBP/USD, USD/JPY, USD/CHF, AUD/USD, NZD/USD, USD/CAD, EUR/GBP, and 44 more |
| Timeframe | The 5, 15 and 30 minute charts load their older history as you scroll back; the hourly and longer ones hold all of it from the start. | 5 minutes, 15 minutes, 30 minutes, 1 hour, 4 hours, 1 day, 1 week, 1 month |
| Remember my setup | Indicators are saved against the symbol and follow it onto any chart; starting clean neither reads nor adds them. Drawings always follow the symbol, on every chart. | Keep my indicators, Start without indicators |
| Grid | Horizontal and vertical rules at the axis ticks, in the same hairline every panel border uses. | Show, Hide |
| Chart type | A currency index on a timeframe that holds closes only is drawn as a line whatever is chosen here. | Candles, Bars, Heikin Ashi, Line, Area |
Questions
What does the Price chart panel show?
WatchTower native chart. 44 assets: FX, metals, commodities, indices. Candles, area or line, across 5m to 1M timeframes. Explain the move reads what carried the move on screen; Replay plays any market forward from a moment in the last year, as the terminal knew it then: the releases as they landed, the wire as it was graded, and the scores and pricing at the close before.
Where does Price chart's data come from, and how often does it update?
Prices from a licensed market data feed, with the terminal's own levels and data drawn on. Live.
Is Price chart free?
Yes, Price chart is on every plan. New accounts start with Pro at $10 for the first month, then $49 a month.
Free on this site: The chart with macro data on it
Also in Market data: Asset statistics · Live prices · Seasonality · Currency strength index · Index breakdown
WatchTower Terminal has 50 panels; this page documents one. Nothing here is financial advice.