Documentation · Market data · Pro
Asset statistics
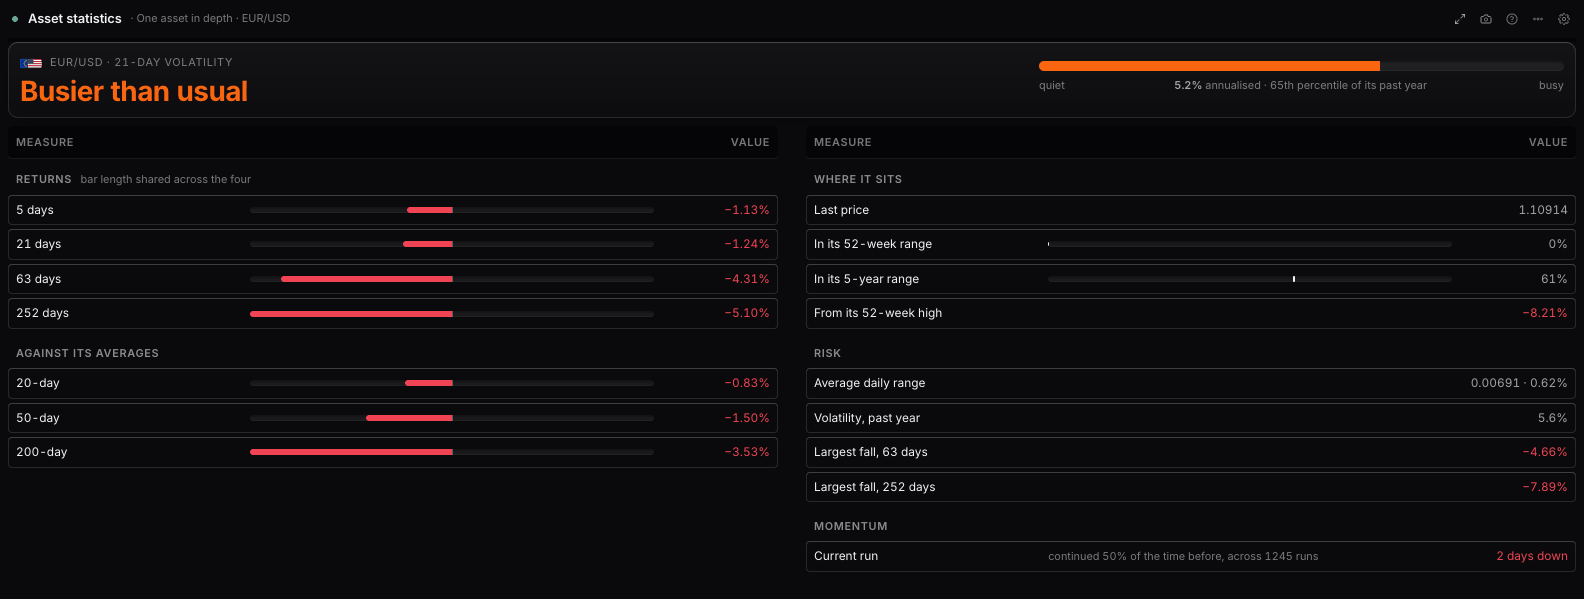
The Asset statistics panel in WatchTower Terminal: what the bars say. It is on the Pro plan, and it is built on each market's own price history.
What it shows
What the bars say. Read one asset in depth with its statistics panel, volatility term structure, return distribution and day-of-week or monthly bias; or every asset ranked by how busy it is against its own history; or how they all move against each other as a matrix or a list of the tightest pairs.
Its reads
- One asset in depth
- Ranked by volatility
- How they move together
The data
- Where it comes from
- Each market's own price history.
- How often it updates
- Live.
- Plan
- Pro
Settings
| Setting | What it does | Choices |
|---|---|---|
| Read | The same bars three ways: one asset on its own, every asset ranked, or every asset against every other. | One asset in depth, Ranked by volatility, How they move together |
| Asset | — | EUR/USD, GBP/USD, USD/JPY, USD/CHF, AUD/USD, USD/CAD, NZD/USD, USD/MXN, and 36 more |
| Visualisation | — | Statistics panel, Volatility term structure, Return distribution, Day of week bias, Monthly seasonal bias |
| Chart | A line reads the shape of a distribution better; columns read a single bucket better. | Columns, Line |
| Bias measure | — | Average return, Positive rate |
| Visualisation | — | Busy or quiet for itself, Ranked by volatility, Average daily range, Table |
| Visualisation | — | Numeric matrix, Colour only, Ranked pairs |
| Candles | — | Daily, Weekly |
| Window | The ranking reads the window the server publishes for it. Correlation measures over the same span of candles. | 10 days, 21 days, 63 days, 252 days |
| Assets | Leave empty for the default set. Correlation reads a day of candles for each one, so a long list is a slower view. | EUR/USD, GBP/USD, USD/JPY, USD/CHF, AUD/USD, USD/CAD, NZD/USD, USD/MXN, and 36 more |
| Summary card | The headline card at the top of the panel. Hide it where another panel on the board already says the same. | Show, Hide |
Questions
What does the Asset statistics panel show?
What the bars say. Read one asset in depth with its statistics panel, volatility term structure, return distribution and day-of-week or monthly bias; or every asset ranked by how busy it is against its own history; or how they all move against each other as a matrix or a list of the tightest pairs.
Where does Asset statistics's data come from, and how often does it update?
Each market's own price history. Live.
Is Asset statistics free?
Asset statistics is on the Pro plan: $10 for the first month, then $49 a month, or $490 a year.
Free on this site: The chart with macro data on it
Also in Market data: Live prices · Seasonality · Currency strength index · Index breakdown · Price chart
WatchTower Terminal has 50 panels; this page documents one. Nothing here is financial advice.