Documentation · Market data · Pro
Currency strength index
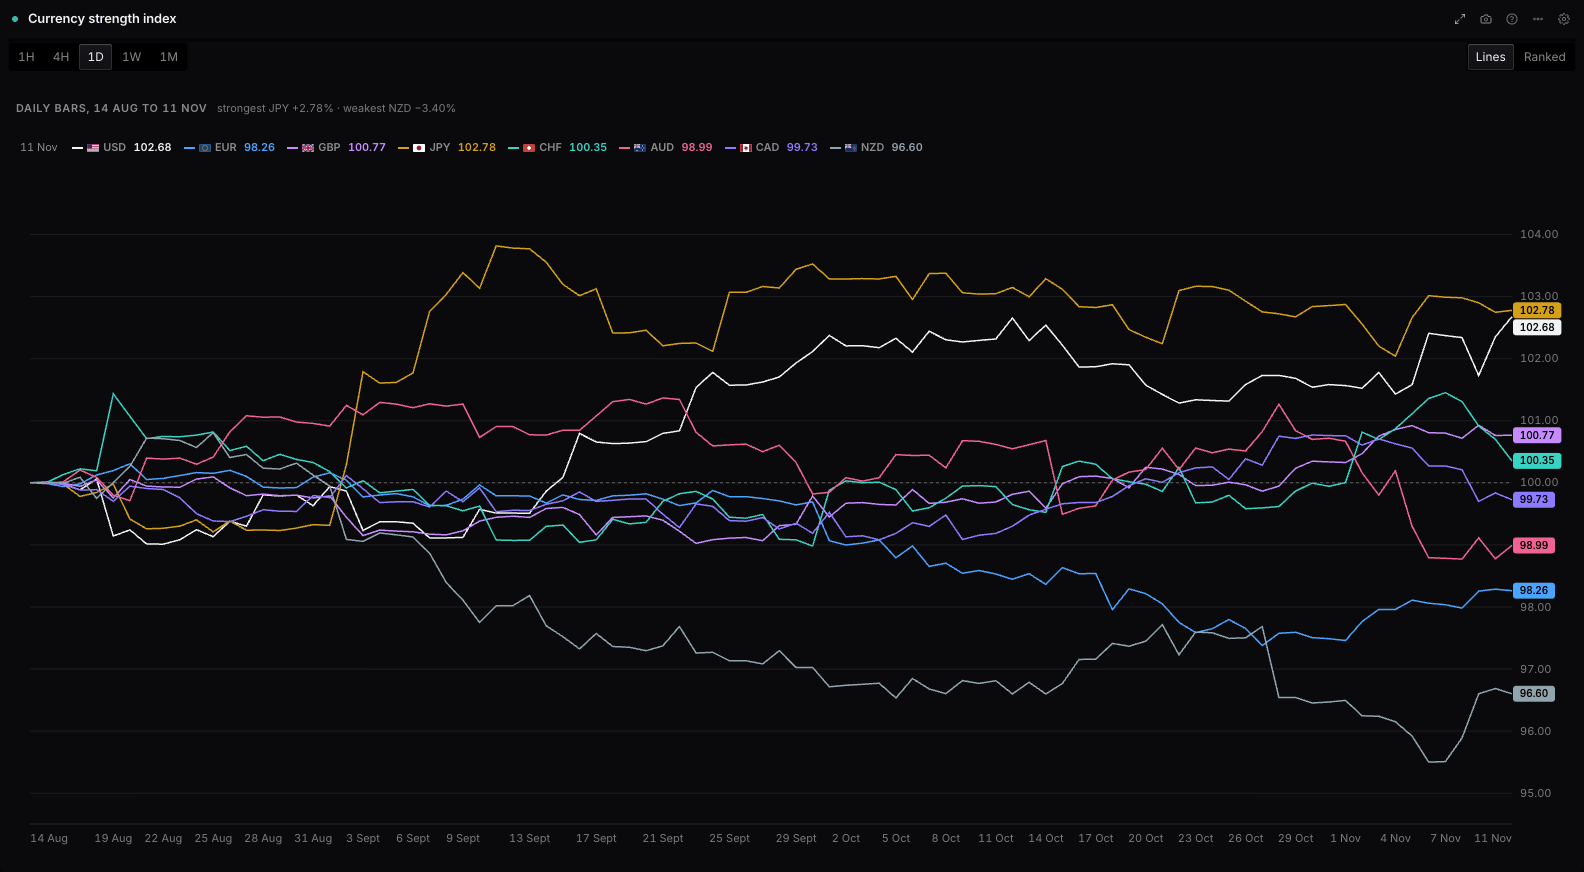
The Currency strength index panel in WatchTower Terminal: relative currency strength over time, each currency indexed to 100 at the start of the window: as lines, or ranked by where each finished. It is on the Pro plan, and it is built on prices from a licensed market data feed.
What it shows
Relative currency strength over time, each currency indexed to 100 at the start of the window: as lines, or ranked by where each finished. Pick the currencies and the timeframe, from hourly to monthly.
Its reads
- Lines over the window
- Where each finished
The data
- Where it comes from
- Prices from a licensed market data feed.
- How often it updates
- Live.
- Plan
- Pro
Settings
| Setting | What it does | Choices |
|---|---|---|
| Currencies | Hiding a currency changes what is drawn, never the numbers: each currency is measured against an equal-weighted basket of the other G8 currencies, the same measure as the currency indices on the chart, whichever ones you have on screen. | All currencies, AUD, CAD, CHF, EUR, GBP, JPY, NZD, and 1 more |
| Visualisation | — | Lines over the window, Where each finished |
| Timeframe | — | Hourly, 4 hour, Daily, Weekly, Monthly |
| Chart controls | — | On the chart, Settings only |
Questions
What does the Currency strength index panel show?
Relative currency strength over time, each currency indexed to 100 at the start of the window: as lines, or ranked by where each finished. Pick the currencies and the timeframe, from hourly to monthly.
Where does Currency strength index's data come from, and how often does it update?
Prices from a licensed market data feed. Live.
Is Currency strength index free?
Currency strength index is on the Pro plan: $10 for the first month, then $49 a month, or $490 a year.
Free on this site: Currency strength meter
Also in Market data: Asset statistics · Live prices · Seasonality · Index breakdown · Price chart
WatchTower Terminal has 50 panels; this page documents one. Nothing here is financial advice.