Video analysis
Gold Bulls Are About to Feel More Pain...
Gold is 31% below its yearly high, and the yields keep rising.
Gold is 31% below its high for the year, and I'm still bearish, with $3,450 the area I'm watching. The Fed is priced for 87 basis points of tightening by July 2027, and with yields rising, bonds pay you to wait while gold doesn't.
The dollar's weekly chart points to 105, then 110. It's bullish but crowded, so I'd rather add on pullbacks than chase. EUR/USD leans bearish towards 1.09, and AUD/USD leans bearish on an RBA holding while the Fed hikes. On the Nasdaq, a Sentinel study shows a 71% chance of revisiting the lows within 20 days after a 4% break below the 200-day average.
The data in this video, live
The figures in the video were read off the terminal on 16 November 2026. These pages show the same data as it stands today, free.
Transcript
4,228 words, with timestamps
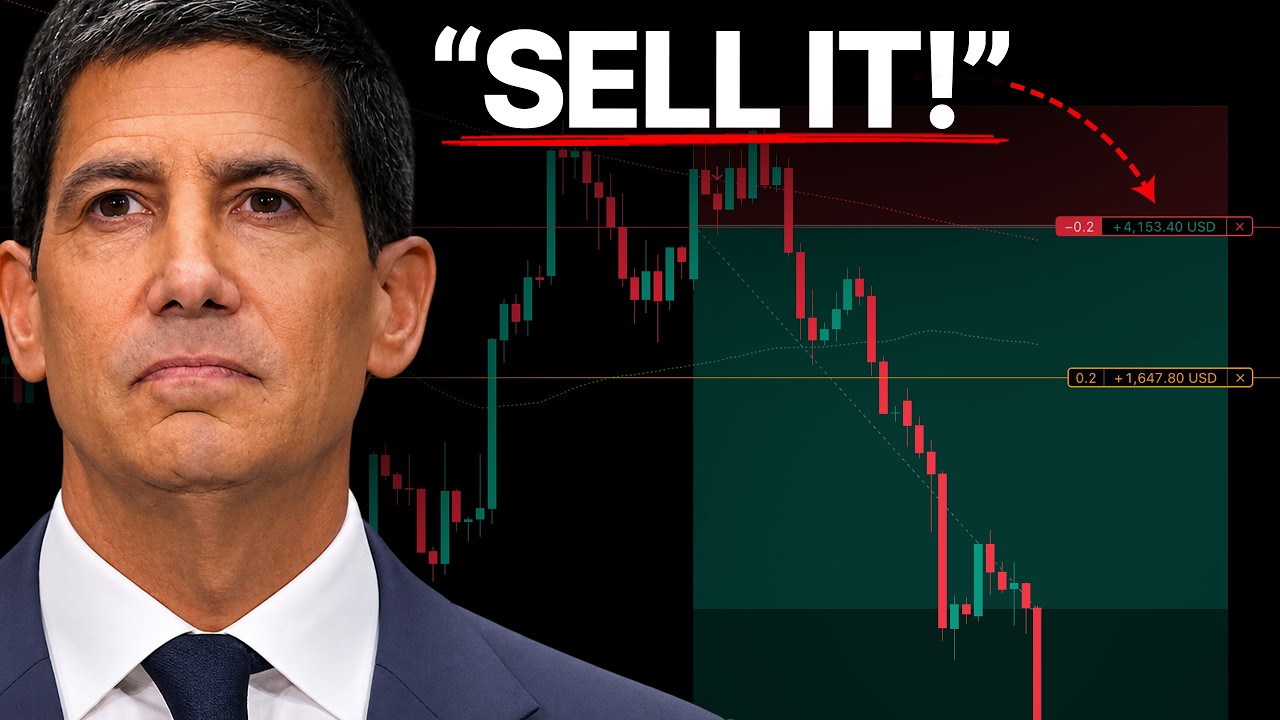
0:00Gold Bulls: More Pain Coming? My Short and the 3,450 Target If you're a gold bull, you might be in for some more pain over the next couple of weeks because gold does look set to continue lower. Now gold has reached over 30% drawdown now. So if we take the previous high that we had earlier this year to where the recent low is, it's down 31%, which is a huge discount, it's a huge decline off its highs. However, gold has now cleared and managed to hold below the 4000 key level. So going back down to the H4 here, I am looking for potentially a scaling. So you can see I am already short here with $4,000 P&L with a stop trailed to lock in $1,600.
So my stop is now trailed pretty tightly to price and the reason is because I need to see this level break. Now it is possible this market does end up coming back but what I would want to see here is a reasonable pullback again. So if we do bounce off this level, obviously we take the Fib from the high to the low, I won't see a pullback to around this 50% retracement, which wouldn't stop me out. Now, if we do come higher and it does stop me out, then I won't scale in and I'll be out for a profit. And at that point, my strategy would no longer be valid. So what I need to see here, again, is that break of the low.
So I want to take my Fib from this high to wherever the low is printed. So let's say we even have a small break lower, then a retest of this level into the prior support into the Fib and then that continuation to the downside after the rejection. And you can see I do have a take profit down here towards 3450. Now the reason for that is if we zoom out, you can see in between basically where price is right now and, that 3500 level, there is no technical support at all. So as long as we do break lower, there is no question in my mind that we couldn't reach 3500 to 3400. Now 3500 specifically is only the top of this wick.
Again, there's not really that much support there. It's just the first place after 4000 or the current area. So beyond there,, 3450 is the very top of the range right here. So that's where I'm looking to take my profits. So if I did manage to scale in, my position ideally would look something like this with a really tight stop again and another take profit down here. So this first trade would actually be close to a 1 to 10 and the second trade here would be around a one to six. So there is a huge potential trade on the table for me at the moment and the current position that I'm in is running about 3.3%. So it's really, really strong at the moment.
2:24Why Rising Yields Are Bad News for Gold Now, why did I say that we could be in for some more pain, especially for the gold bulls? Well, if we look at the yields here, yields are coming back to the upside. Now, as we've been discussing on this channel, when yields are moving higher, that means that bonds are more attractive because investors don't get anything to hold gold. There is no return there. So for anyone that is investing in gold and accumulating gold, the only way they make money is if gold does appreciate in value, which as we just looked at, hasn't happened all year. Gold is down over 30%. So now if bonds are going to be paying investors roughly 5%, the opportunity cost favours bonds much more than it does with gold. And again, now we are seeing yields moving back to the upside. This is again becoming a lot more favourable for buying bonds as opposed to holding gold.
3:11The Dollar Weekly: 105, Then 110 And the US dollar is continuing to rally higher. So if we go out to the weekly timeframe here, we can see that we are starting this bullish rally, something I've been speaking about for months at this point. So in 2025, when the dollar came down to this trend line, everyone was a doomer. I was finding it very, very difficult to get bearish on the dollar. First of all, because I don't like to bet against the US, it's the world reserve currency. It's a huge economy and also because of what we've seen previously when we come down to this trend line on the weekly timeframe We do have these bullish rallies and bullish cycles every single time.
So when history is telling me something, I like to listen. Because history doesn't always repeat, but it can rhyme as the saying goes. So now we can see that same sentiment coming in where we've had a really strong push off this trend line. So the next real stopping point is around 105. If we break above 105, then it would be around 110.
4:05WatchTower: Gold Scores 37.2, Bearish So I don't really see much stopping the US dollar to continue in to run higher. And then we can go over here to the WatchTower and we can look at gold. We just open the drill down here we can see it's got a score of 37.2, which is bearish. So down here we can see gold's individual score is 35, whereas the US dollar is 60. So we can see gold bearish, the US dollar is bullish. And the final view here says the Fed held at the October meeting and the markets now priced 27 basis points of tightening by the 9th of December which is the next meeting with rates expected at 4.87% by July, 2027. So we can go down to the central banks tab down here for gold and we can see the Federal Reserve.
4:45The Fed: 87bp of Hikes Priced The implied rate at 4.87. Now the Fed is currently at 4%. So what does this mean? The markets are pricing 87 basis points of tightening by the Fed. And we can see that reflected down here on the future meetings. The next meeting in December is a 100% probability of a hike. January 74% probability of a hike. March is 66% probability. So the markets are clearly expecting the Fed to continue raising rates. So then we can have a
5:12US Fundamentals Score 60 Look at the US fundamentals here. The US dollar is getting a score of 60. Everything here is currently looking quite bullish. Now there are some slightly negative readings, but the misses here are not drastic enough for the watchtowers algorithm to read them as bearish. So for example, PPI came out at 6.5 from the forecast of 6.6 that miss isn't meaningful enough. But then we can look at JOLTS, which is bullish, NFP, which is bullish. We've got manufacturing PMI, bullish retail sales, industrial production and wage growth all bullish as well as other readings that aren't quite reading bullish like ADP, but are a good sign for the US dollar strength. And then we can also look
5:51COT: Smart Money Sells Gold, Buys the Dollar At COT data that came out gold had a really nice move to the downside. So we can see the change week on week negative 1948. Whereas the US dollar had a positive change of 153. So we can see smart money is clearly buying the dollar and been selling gold. And if you just look at what's been happening on gold's week on week change for the past few weeks, it's just been a consistent outflow. Only one week on the previous release on the 27th of October, they actually bought a small amount and then we see the opposite for the US dollar, a small out flow on the same week where gold had an inflow, but other than that, a massive increase in the US dollars net positioning to the upside.
6:30The Banks Turned on Gold And then bank research here, we see gold has gone to mix. Bear in mind, this actually normally sits at bullish. So the fact this has gone down to mixed is quite a big sign in itself. 19 bullish calls, 25 bearish and six neutral whereas the US dollar is net bullish. We've got 167 bullish calls, 119 bearish calls and the bank research specifically for X AUUSD does lean bearish as well. So we can see the banks are currently talking about hot inflation and a hawkish fed response, low yielding CHF under pressure from US rates macro driven dollar strength, yen under pressure, short dated euro dollar swap differential at its widest level.
Under key drivers for gold at the moment are the hawkish fed environment, high interest rates and oil price surging. Rising yields and dollar strength, rising yields, pressure in gold, US dollar strength and risk off sentiment. And the final
7:20Iran, Hormuz and Brent Oil Cherry on the cake, we can go to news and we can isolate what's going on in Iran. So if we just click on the globe, we isolate Iran, we can see on November the 5th, Iran Navy claims tanker hit mine in Hormuz. Thursday morning IRGC reports two tankers. Antog caught in strait, seized drones via electronic warfare. Oman, Iran foreign ministers discussing lasting security arrangements for sea routes, shifting from de-escalation to permanence. So here on Brent oil, you can see we had a strong move to the downside, retesting our 200 daily moving average like we saw previously, but now we're starting to see this market catching a bid and moving higher yet again which repeats what we've seen previously where oil gets to an elevated price or an uncomfortable price, we see de-escalations, but then they don't lead to anything.
Like here we had the P-steal that was on the table. Oil had a large move to the downside. It didn't lead to anything. The markets just continued to buy the dip. We didn't see that follow through. And we've seen the same thing, repeat, repeat and repeat. So now the markets are, looks like buying up again because we're not seeing any follow through and we are expecting that strait to remain closed. So all of this is leading to gold's pressure to the downside. So as I said, as long as this low breaks, I really do see the next stopping point around 3500 to 34
8:38My USD/CAD and USD/CHF Longs 00. I'm also long here on the US dollar card, I drew the Fib from the low to the high, but on this pullback into the Fib, retesting the prior level of resistance on the left. And so far, so good. So you can see I'm clearly expressing my dollar bullish thesis here. Now if we zoom in, you can see I'm actually looking for potentially a scale in. So I've got the fit from the low to the high or where the high currently is, potentially looking for a pullback here to the 61.8 retesting some minor resistance and then potentially looking for that rejection and continuation higher.
Now the problem with that is I am very close to my target, so my take profit is almost hit. So regardless of what happens here, I'm pretty much setting stone to be a winner because my stop is already trailed to break even so I do have room to actually trail my stop even further if I do see fit. Now I'm also long US dollar Swiss on exactly the same thing. So we've got the low, we've got the high, we saw the pull back into the Fib zone, retesting the previous resistance level bullish trend on the daily timeframe. We've had a really strong rejection to the upside. So I'm looking for a correction of the left side we've seen over here.
We've got very impulsive, aggressive candles. So I would expect this market to continue higher. I'm looking to take profits at the previous lows here on the daily, which is around the 0.87 area, but it's the same theory. If we do see some sort of topping price action here, I'll take the Fib from the new low to the high, looking for a rejection or retracement back into the Fib zone then the rejection and continuation to
9:58The Dollar Is Crowded: Why I Buy Pullbacks The upside. So you can see I'm very clearly bullish on the US dollar. However, I do think this market is becoming a little bit crowded and a little bit stretched. That doesn't mean I'm looking to go short. That does mean, however, that I am looking for pullbacks to be a buyer rather than looking to be a buyer right now. So you can see this 105 area where we are coming into. So here If, we just change this to resistance, you can see that this again is sort of the next potential stopping point or pausing point for the dollar. So if we draw a Fib from the low here, to let's just say the high around 104.6, we could see a pullback into the Fib zone, which would line up with the previous highs, which could be a.. fantastic buying area or opportunity as long as the macro landscape we're currently in remains
10:41EUR/USD: No Pullback to Sell Intact. Now there are some other markets I'm looking to get into. So for example, Euro dollar, I would love to go short, but the problem is, this market is not providing any pullbacks for me to trade into. So you can see a beautiful bearish channel. We've got the daily moving averages at a bearish. So I've taken the Fib from the high here and I'm actually looking for Eurodollar to breach a low which would be around 1.09. So you can see this is kind of the next support level. I don't really see Eurodollar reversing here for kind of no reason. There's no technical support there's no fundamental reason for that to happen.
Of course it could, but that's just not what I expect. So I would look for this low to get created here, then maybe pull back to the top of the range, or maybe even the low of the range right here. And then looking for this continuation to the downside. So unfortunately Euro dollar is a little bit messy. I do see a couple of ways in, but it's not very clean. It's not ideal by any means.
11:32GBP/NZD Long Idea So then moving away from the dollar, I do actually really like the pound New Zealand. So we've got a really nice bullish trend here on the H4. We've had a push higher. A little bit of a resistance here that kind of saw the break again. It's not super, super clean technical price action, but we did see a pull back into this area. We've kind of retested the 50% zone. It's again, not perfect by any means, but I would be willing to be a buyer because I think the fundamental backdrop behind PAM New Zealand is strong enough to be, to warrant a trade. So I would have a stop loss just below this 200 moving average because if this support level is broken, the 200 moving average is broken, I don't want to be in the trade anyway. And then I would be looking for a tick profit around the Fib extension at negative 61.
12:13WatchTower Trade Scanner: Peso, Yen and Metals 8. So back here on the WatchTower, if we go to the scanner and we just maximize this, you can see we've got New Zealand Mexican peso, which is bullish, pound Mexican peso, bullish. So we've clearly got a bearish Mexican peso at the moment. That's not a market I trade, so I don't look at those at all, but they are under WatchTower. Pound card is bullish. We've got pound Aussie, which is bullish. We've got US dollar, card bullish. We do interestingly enough have the Dow bullish as well. I'm not very interested in buying the Dow Nasdaq or the S&P, which I'll move on to shortly.
We've got Euro New Zealand bearish, Euro Yen bearish, Aussie Yen bearish, who clearly got actually a bullish yen theme going on as well. Aussie US dollar bearish. Euro US dollar bearish. You can see we've got a lot of bearish readings as well as the metals down here actually the most bearish gold. Silver, copper, oil, all bearish. We've also got platinum and palladium down here. Now I'm actually not looking to go short oil obviously given the current situation in Iran. But that is a bearish reading at the moment. So we do have some very clear readings here. Unfortunately, Pown New Zealand actually isn't on the WatchTower, however it is
13:10EUR/CHF Short Idea On the EdgeFinder Now,. Euro Swiss is one I am actually quite interested in. So if we look here, the daily timeframe is looking quite interesting. We've obviously got a pretty nice high here. We've potentially created a lower high in the Fib zone. So if we draw the Fib from the high of the daily to the low, you can see we're currently sat within the 50% to the 61.8 area, retesting the daily 200 moving average. But then if we go down to the H4, you can see a really nice technical setup here. The market has retested the H4200 moving average, showing a really nice rejection to the downside inside this daily Fib so we could be looking for a really nice move lower.
Now if we go over to the weekly timeframe, you can see a very bearish trend. Now this replicates or is mirrored across a lot of different Swiss pairs. If you go to pound Swiss, New Zealand Swiss, Euro Swiss, they are all very bearish on weekly timeframes. So I don't actually mind and I do quite like the idea of fading upsides on Swiss pairs like we've got here, looking for a continuation to the downside. So I think Euro Swiss could be a great trade. Now it is a little bit messy. The price action is not great on Swiss pairs. It can be very choppy and very noisy, but overall I think it probably is worth an attempt.
14:19AUD/USD: RBA vs Fed Divergence Now of course I am also looking to go short on the Aussie US dollar. We've had the daily moving averages here just cross bearish. We've broken the daily level of support. So again, looking for a Fib high here potentially creating a low at the next level of support on Aussie US dollar. Retracement back into the Fib zone, retesting the prior level of support for that break and retest into the Fib, into the bearish daily trend and a continuation to the downside. And again, the WatchTower is bearish here. So if we go back to the WatchTower, we click on Aussie US Dollar, you can see a score of 42 but the Australian dollars got a score of 49, the US dollar has a score of 60, but the really interesting thing is if we go to central banks.
What we see is a very clear divergence. We've got the RBA at 4. 85 and the Fed at 4%. So RBA or Australia clearly has a higher interest rate than we see in the Fed or the US. But the really nice thing is the implied rate that we see here. So 4.7 for the RBA whereas we've got 4.87 for the Fed. So the markets again are expecting those Fed hikes, whereas actually the implied rate by the RBA has been decreasing and in the future meetings, as we've already discussed, the Fed is expected to hike, whereas the RBA has no hikes priced in whatsoever. So we can see December 100% probability of a hold, 9th of February is 78% hold, so on and so on. So again, a very clear central bank divergence
15:39Nasdaq: What Sentinel's Crash Study Says That we could expect to the short side and as a US dollar, I really like this trade. Now next up is the Nasdaq. Now there's something quite interesting going on here. So we did ask the Sentinel, which is the AI built into the WatchTower in last week's Sunday watch list video and we can see what happens here. So Sentinel basically went onto the Nasdaq chart, exported or read all of the price data, collected the statistics. And basically, when the Nasdaq falls 4% below, or falls 4% and breaks below its 200 daily moving average, these are what we can expect.
So undercut the crash daily close within 20 days, 71% probability, the plausible range is 50% to 86%. So this is seeming like one of the most likely outcomes. Now back to the pre-crash close within 60 days is a 76% probability. So the range is about 55 to 89%. The next 20 days, median or middle half, we can expect a 0.2% decrease. Now the max has been negative 7% and the max positive has been positive 6.3%. The next 60 days we could expect it up 4.4%. The worst it's done is 4.9 or negative 4.9. The best has been 10.7. Again, we did look at this and at the time, the Nasdaq was seeing a bit of a recovery.
But now what we're seeing is the Nasdaq did obviously break its 200 moving average. It declined over 7% in this entire move came back up, retested its 200 daily moving average, and on Friday, closed back below. So this could be exactly what Sentinel told us, which is where we do re-come or revisit the previous low we just formed. So a dead cap bounce is essentially when we have some sort of relief bounce, but actually we continue lower. I'm not 100% set in stone, the Nasdaq is going to continue lower from here. But again, based on the statistics we have, it is very, very likely that we revisit this low.
Maybe we double bottom and continue higher from there. Maybe we slightly sweep the low and continue higher. I don't know. Or maybe we do continue much lower from that point. But what I'm trying to say here is based on the statistics we've got from Sentinel, I'm not looking to be a buyer of the Nasdaq at this point.
17:51S&P 500: Why I Closed My Long Now, I was actually in a long position last time we spoke on the S&P. So I bought the S&P. Roughly here like this. I think my position was very very similar to this now I did have a stop trailed here, but I decided to close out on Friday, I just didn't really like the set up. We look like we're sort of creating a lower high here relative to the previous high. We're below the daily 50 moving average. And again, what we've just looked at on the Nasdaq did give me the spooks a little bit. So I decided to close out for a tiny win and just call it a day.
18:21Where I Stand I might revisit these markets in the future, but for right now, I'm just gonna stay on the sidelines, continue long on the dollar, continue short gold. And I may look to go short at some point, but I'm not looking to go short on the S&P. My focus right now really is just the Nasdaq. So if we can clear out the minor sort of wick lows we've got in this area, I actually may look to take a short position. If we end up breaking this low, I would solidify the short idea and try to get into a bit more of a higher size or larger size trade to the downside. But for now, as I said, I'm looking to just kind of stay on the sidelines.
I'm not overly bothered what happens. For now, again, it's more a case of, do we end up coming lower than this low, or do we actually start reclaiming prices above the daily 50 moving average? In that case, then I would turn bullish again. EdgeFinder and WatchTower are bullish on the Nasdaq. So in that case, I would follow the readings if we end up breaking lower, in that case I'll follow the statistics. So I'm kind of prepared for either way.
19:12Get WatchTower for $10 Now remember if you want access to the WatchTower you can get Sentinel, you can get all of the data, macro data seasonality, positioning, interest rates, implied rates, and a really, really strong trade scanner, as well as live updates on global situations and a live newsfeed. You can get the WatchTower for just $10 with the first link in the description. And if you've enjoyed this video make sure you like and subscribe. Thank you for watching, stay safe and don't get margin called.
The transcript as published on 16 November 2026, lightly cleaned. Spoken analysis for education only. CFDs are high risk and most retail accounts lose money.
Every number in this video came off the board.
Composite scores on 27 markets and the Analyst videos panel, with positioning across 44 and the research behind them. The terminal is $10 for your first month, then $49 a month. Cancel from Billing at any time.


