Stocks
2,900+ stocks, each one scored every night
The members of the S&P 500, Nasdaq 100, Dow, Russell 2000, DAX, FTSE 100, CAC 40, Euro Stoxx 50, IBEX 35 and Nikkei 225. Each stock is read on its earnings, its estimates, its price, its accounts and the macro behind its index, and every part of the score opens up.
From an index down to one stock
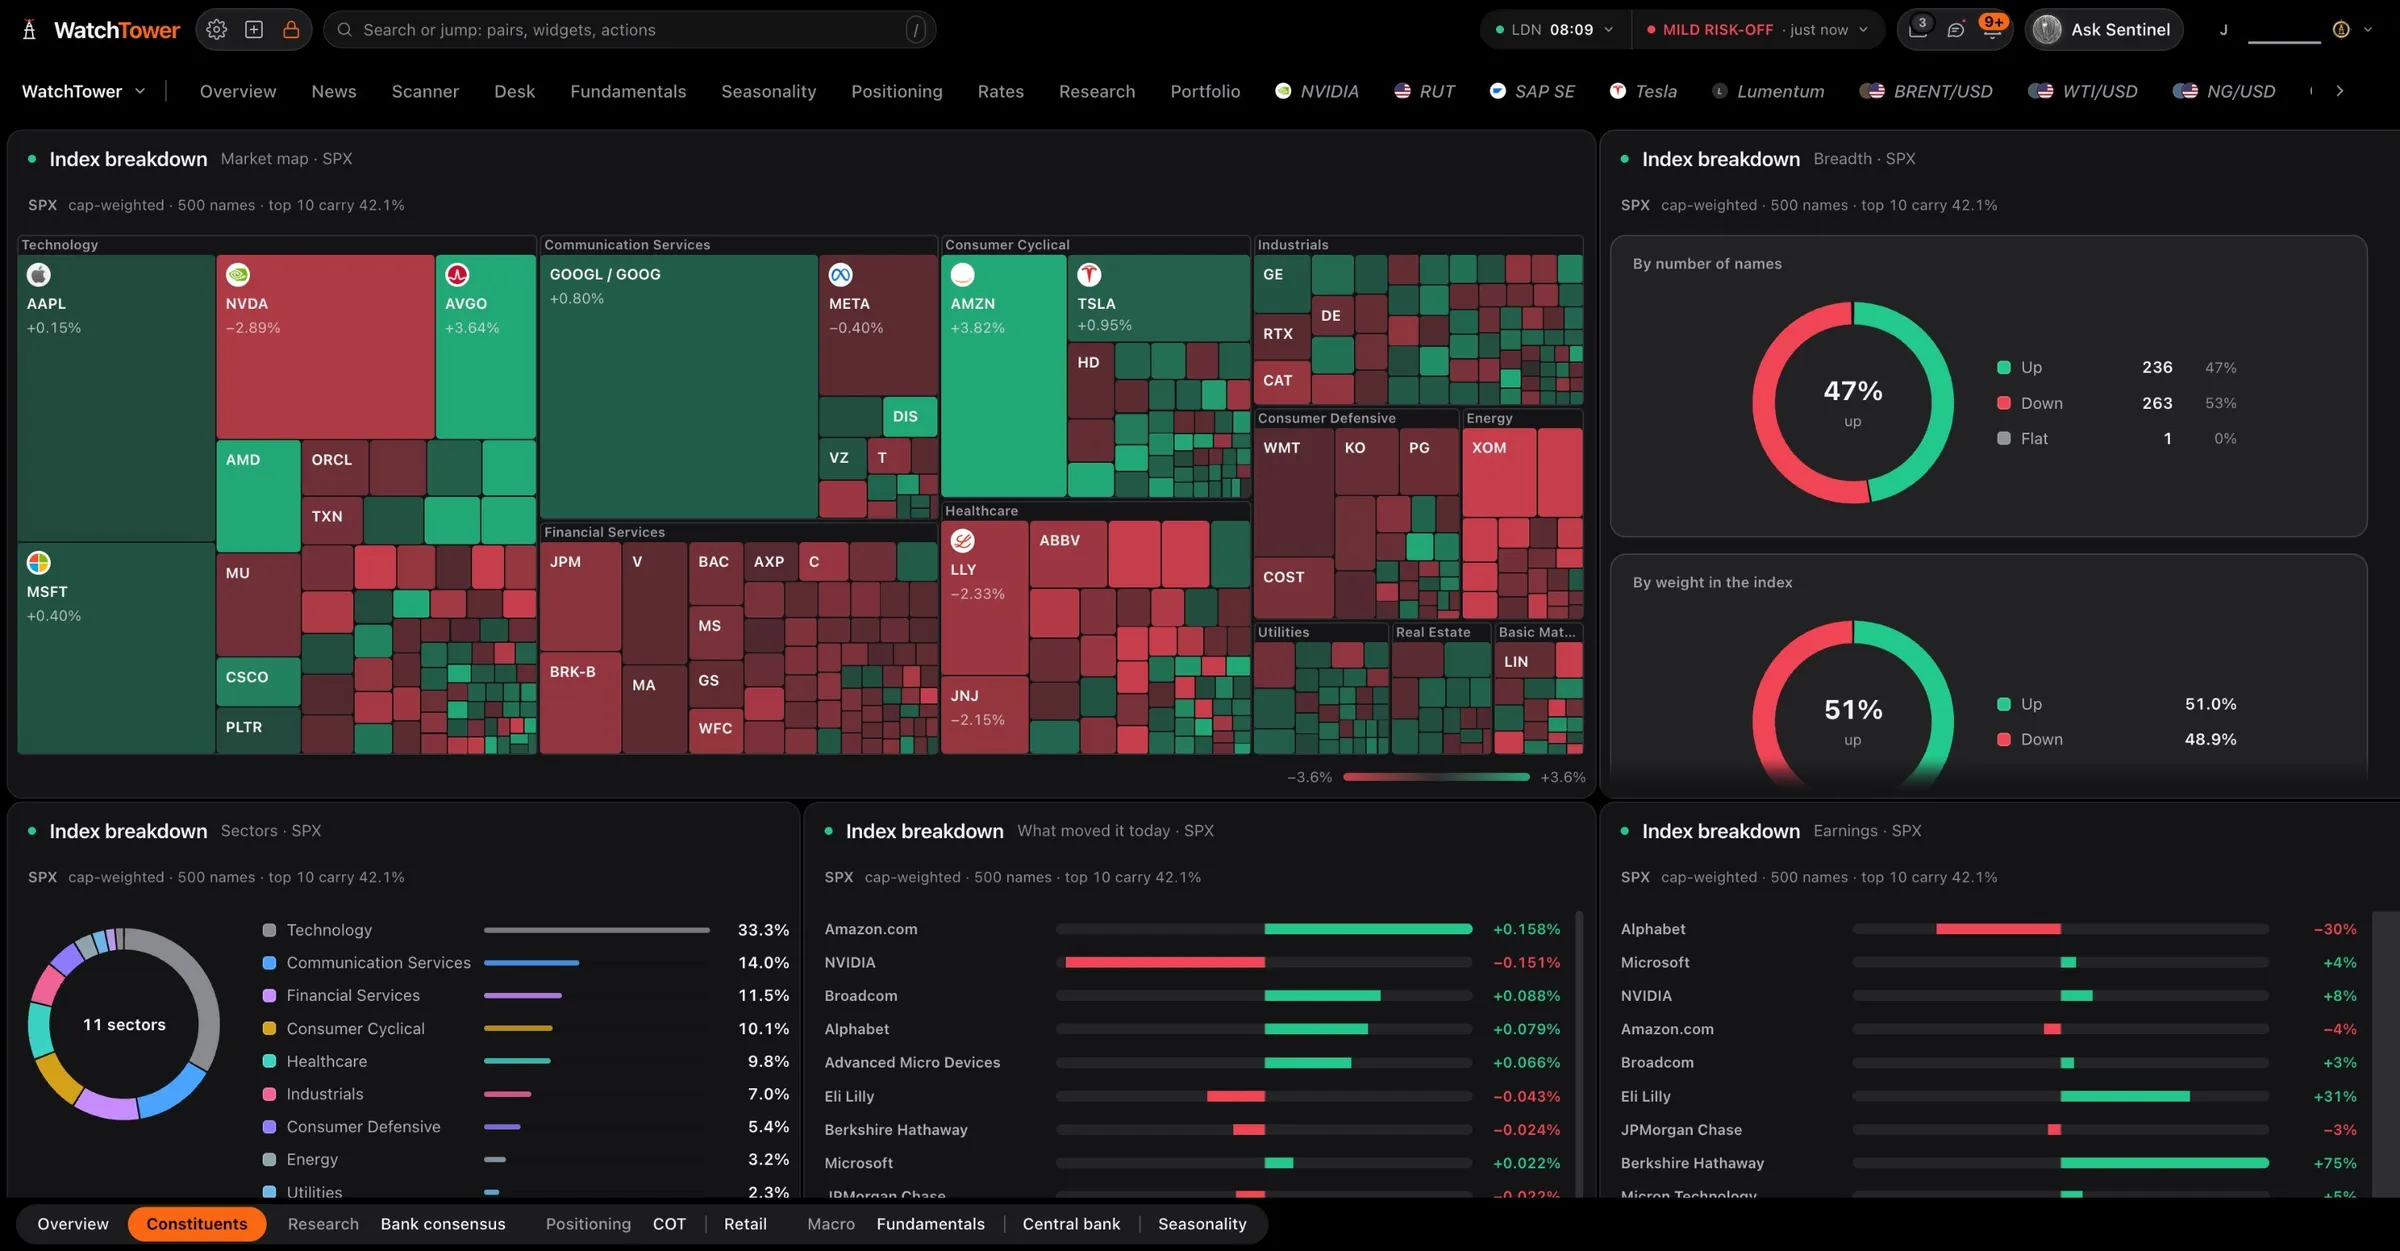
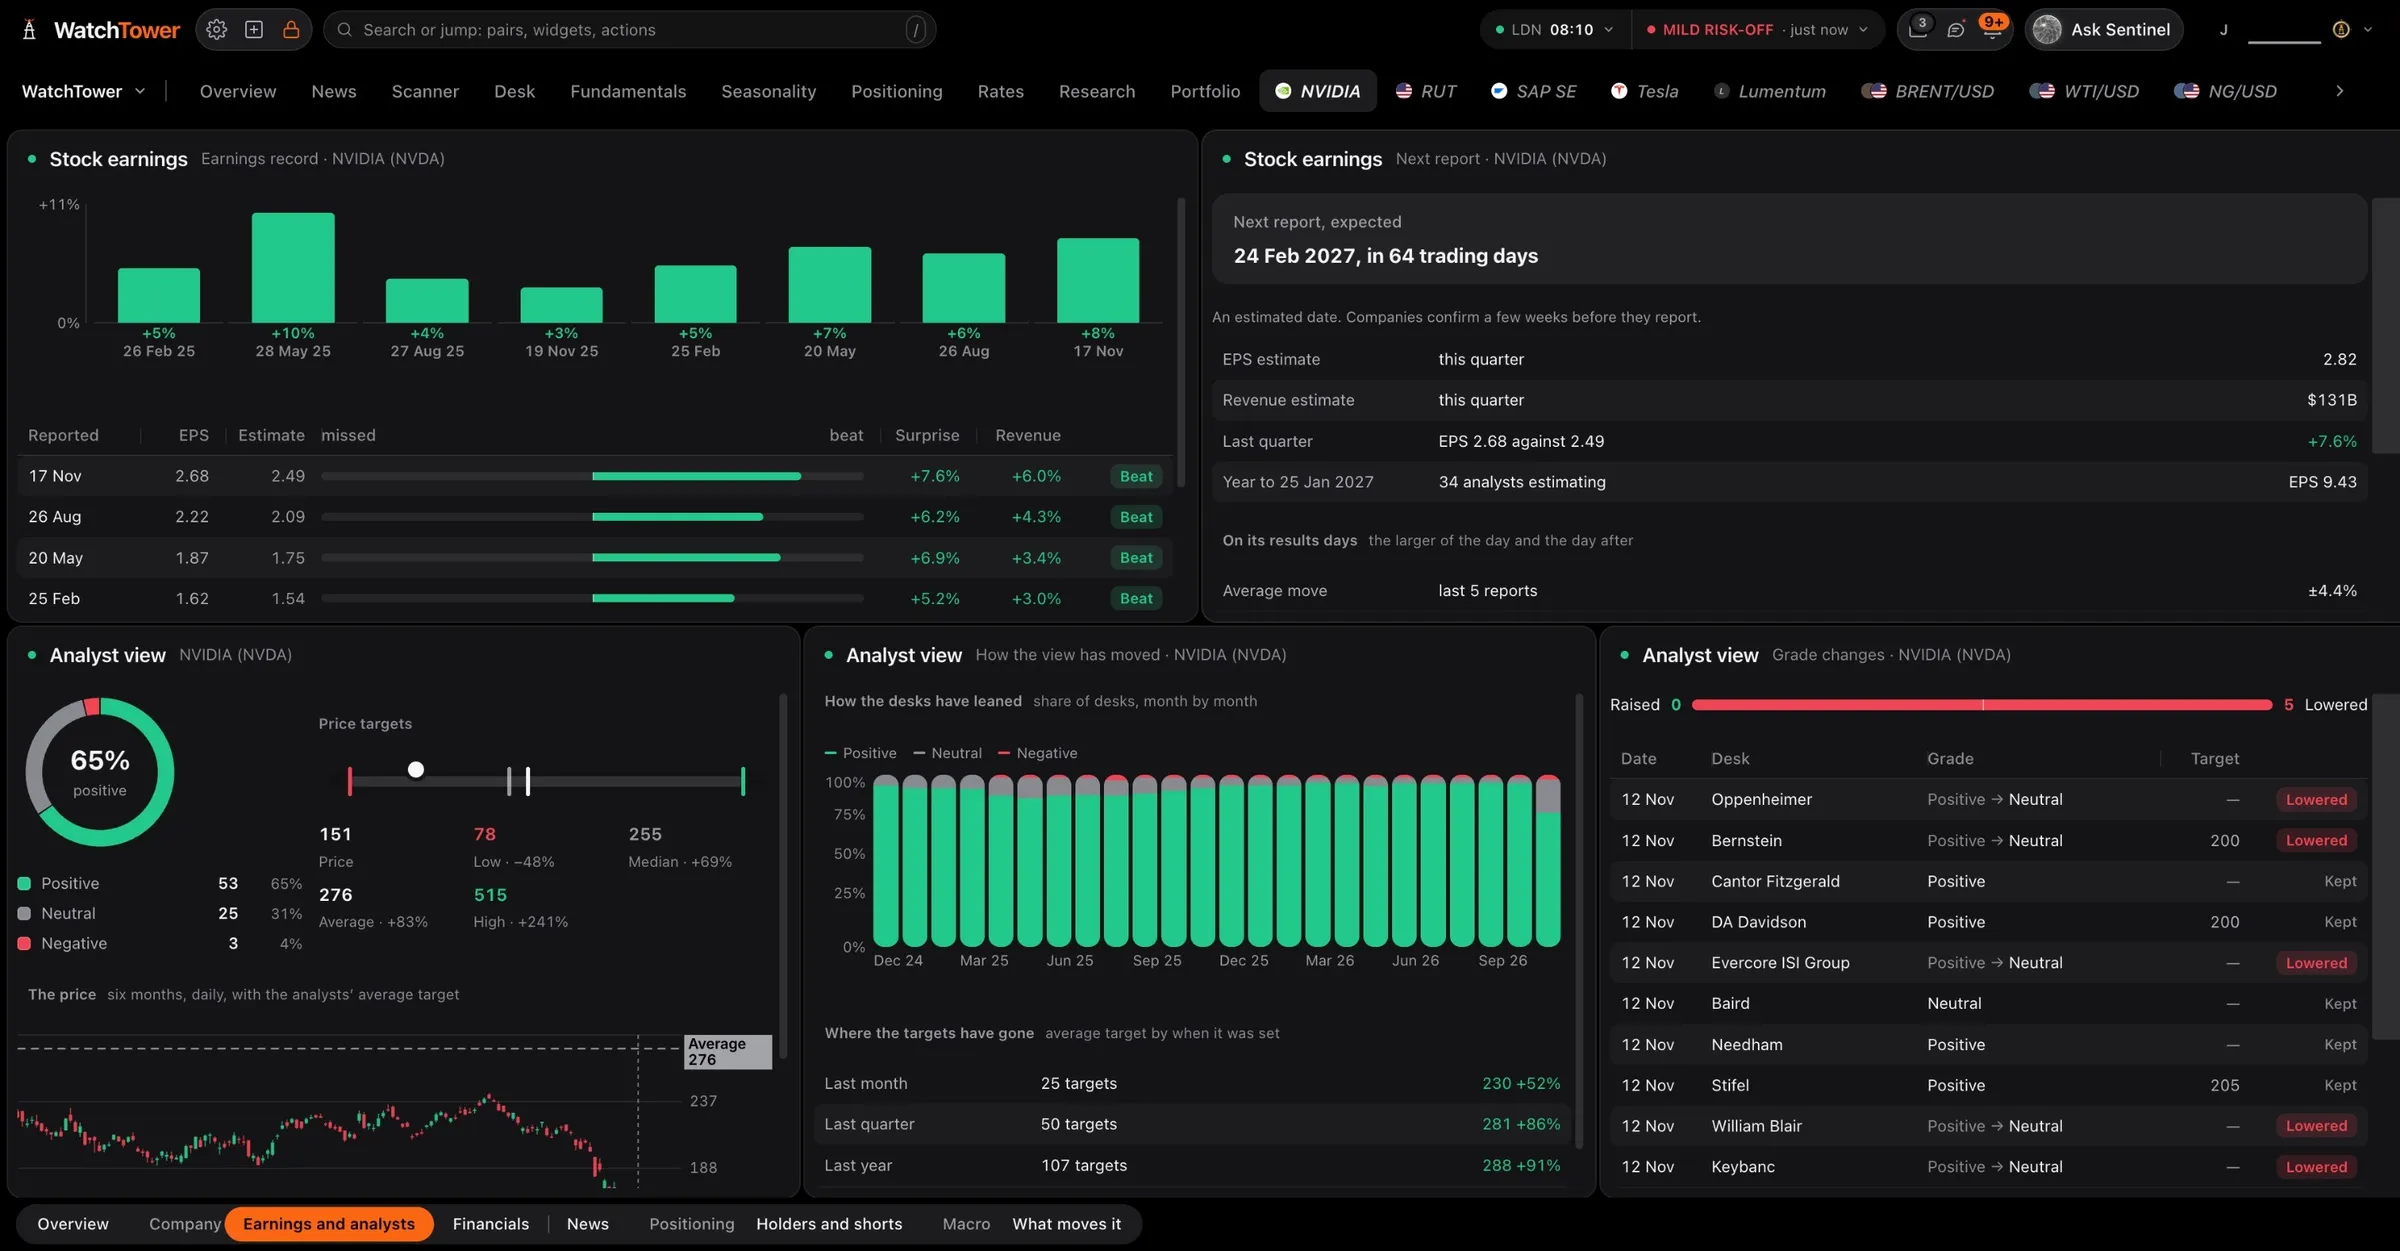
Open an index for its market map, its breadth and its sectors, then pick any name for its score, its earnings record and every analyst change.
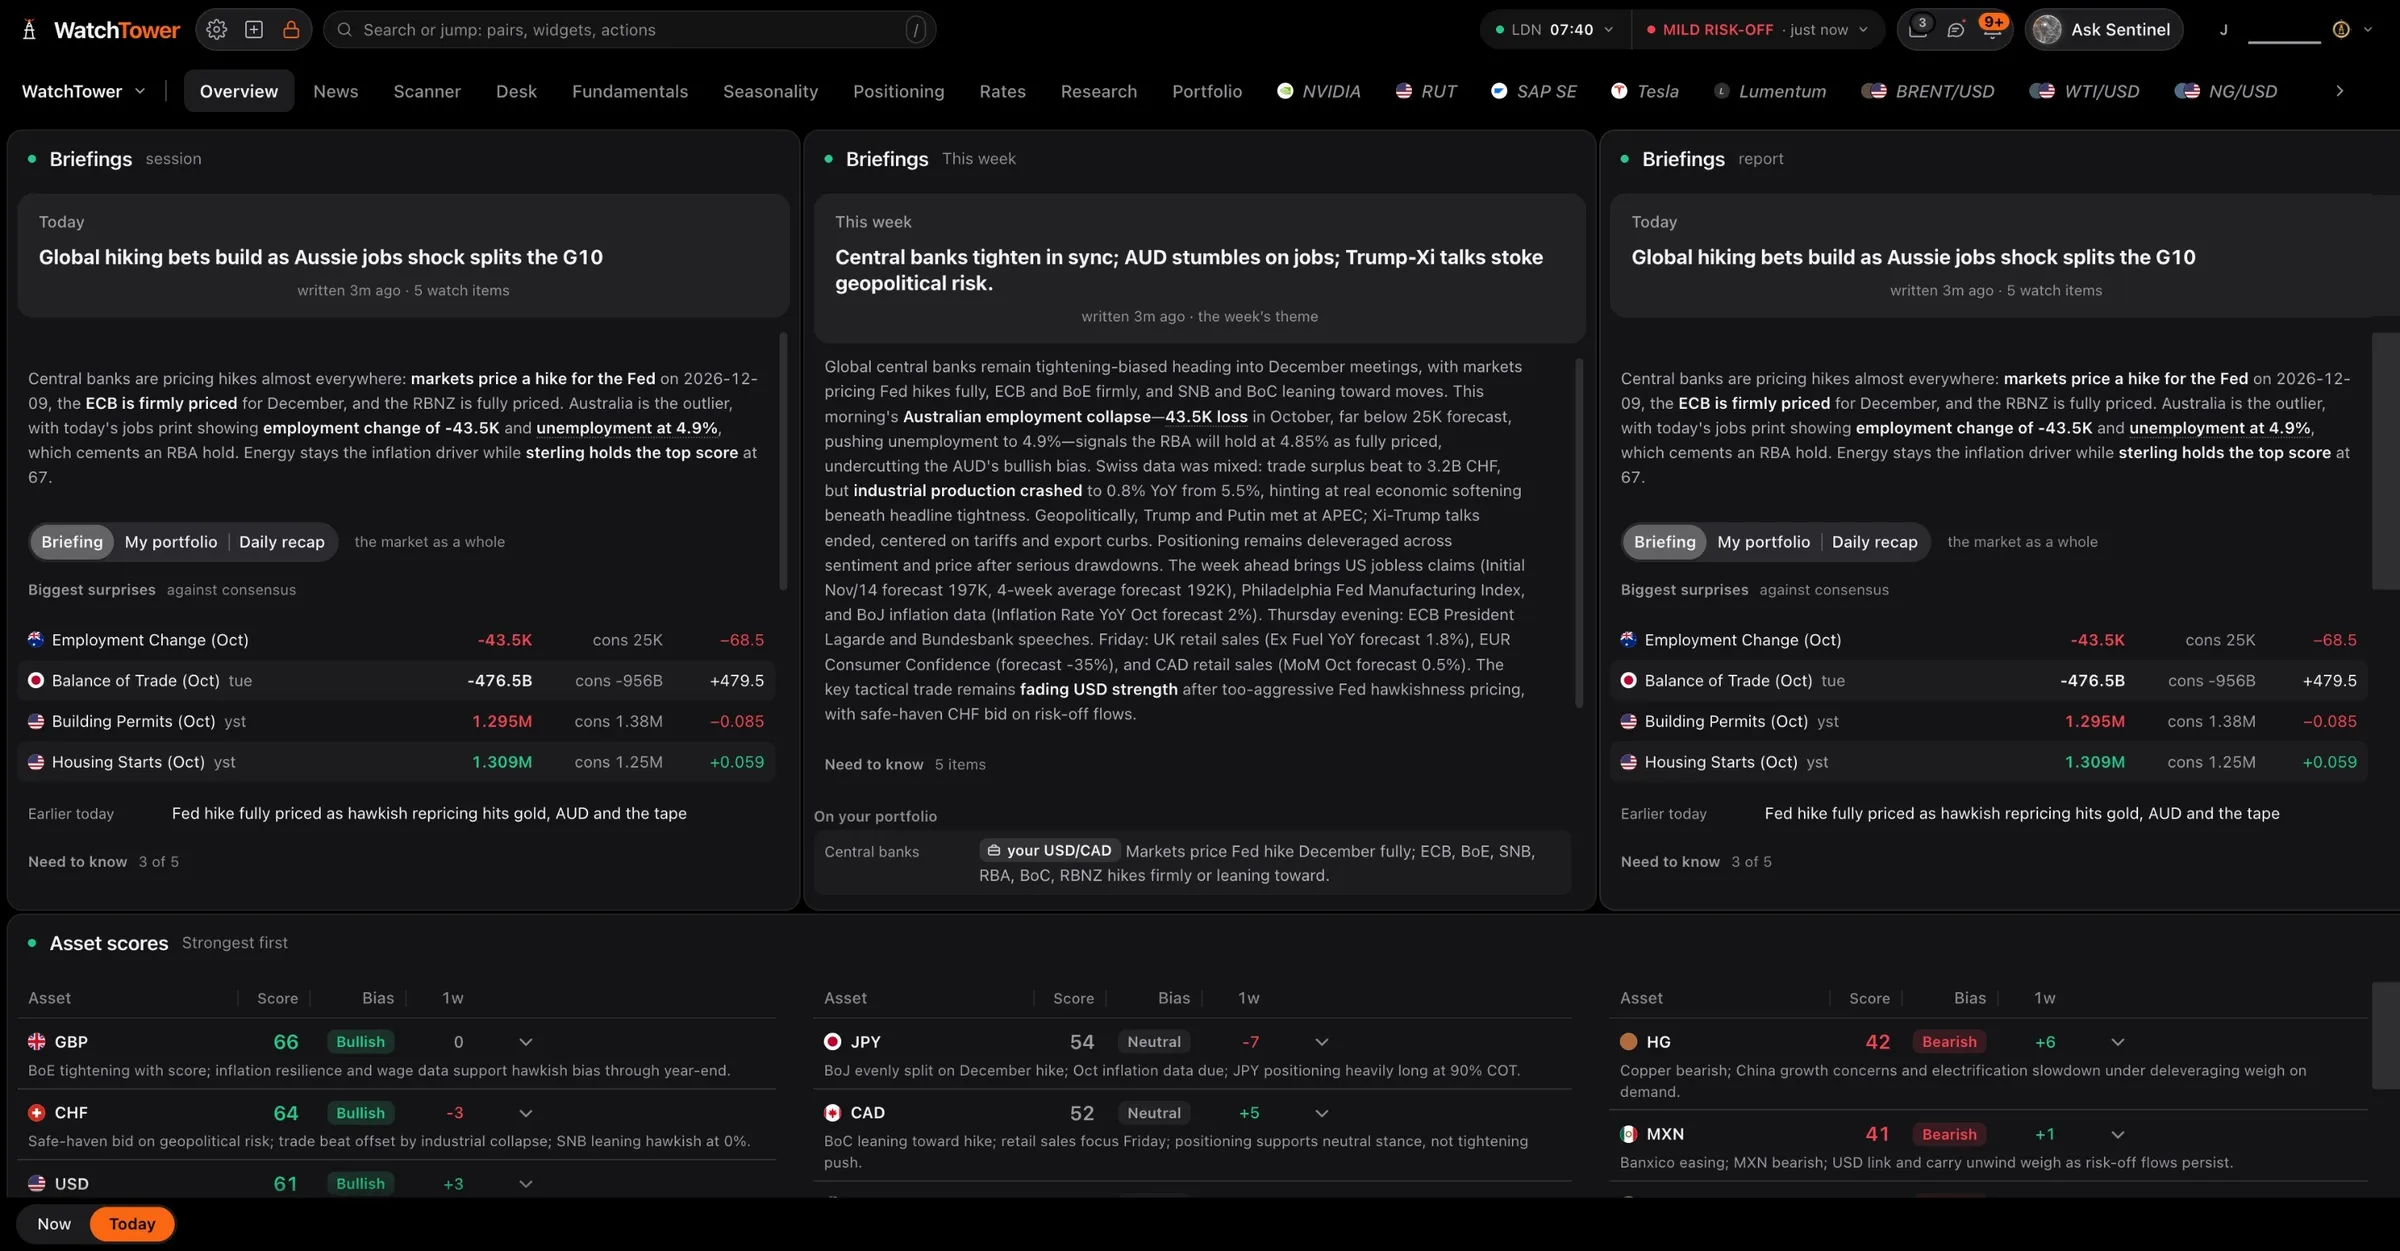
OverviewThe day’s briefing and every score
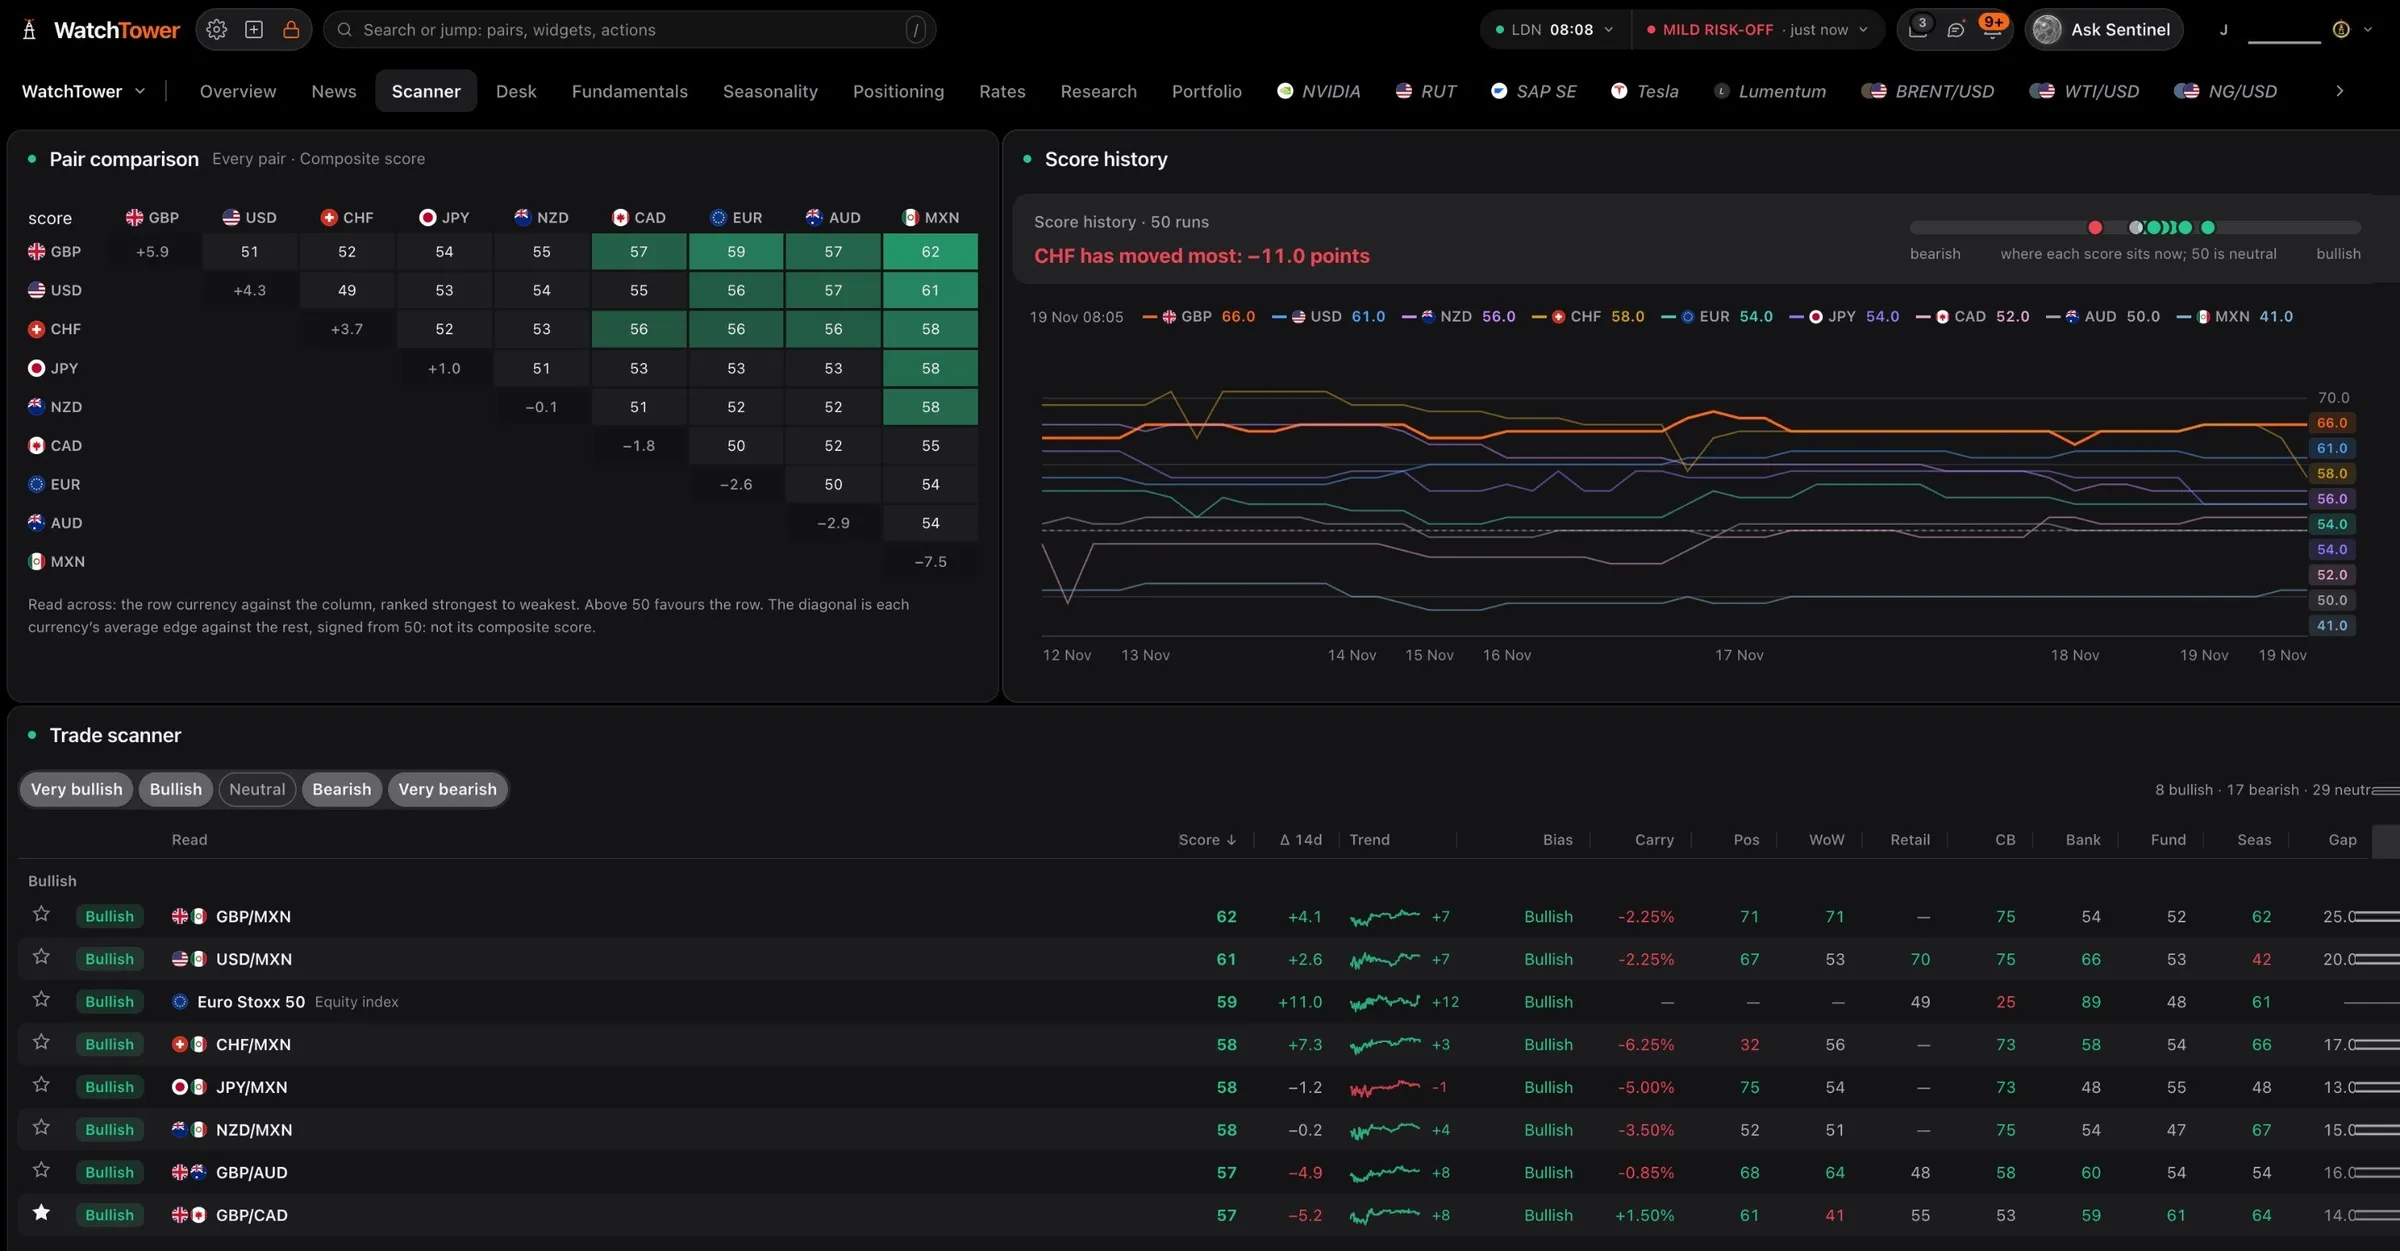
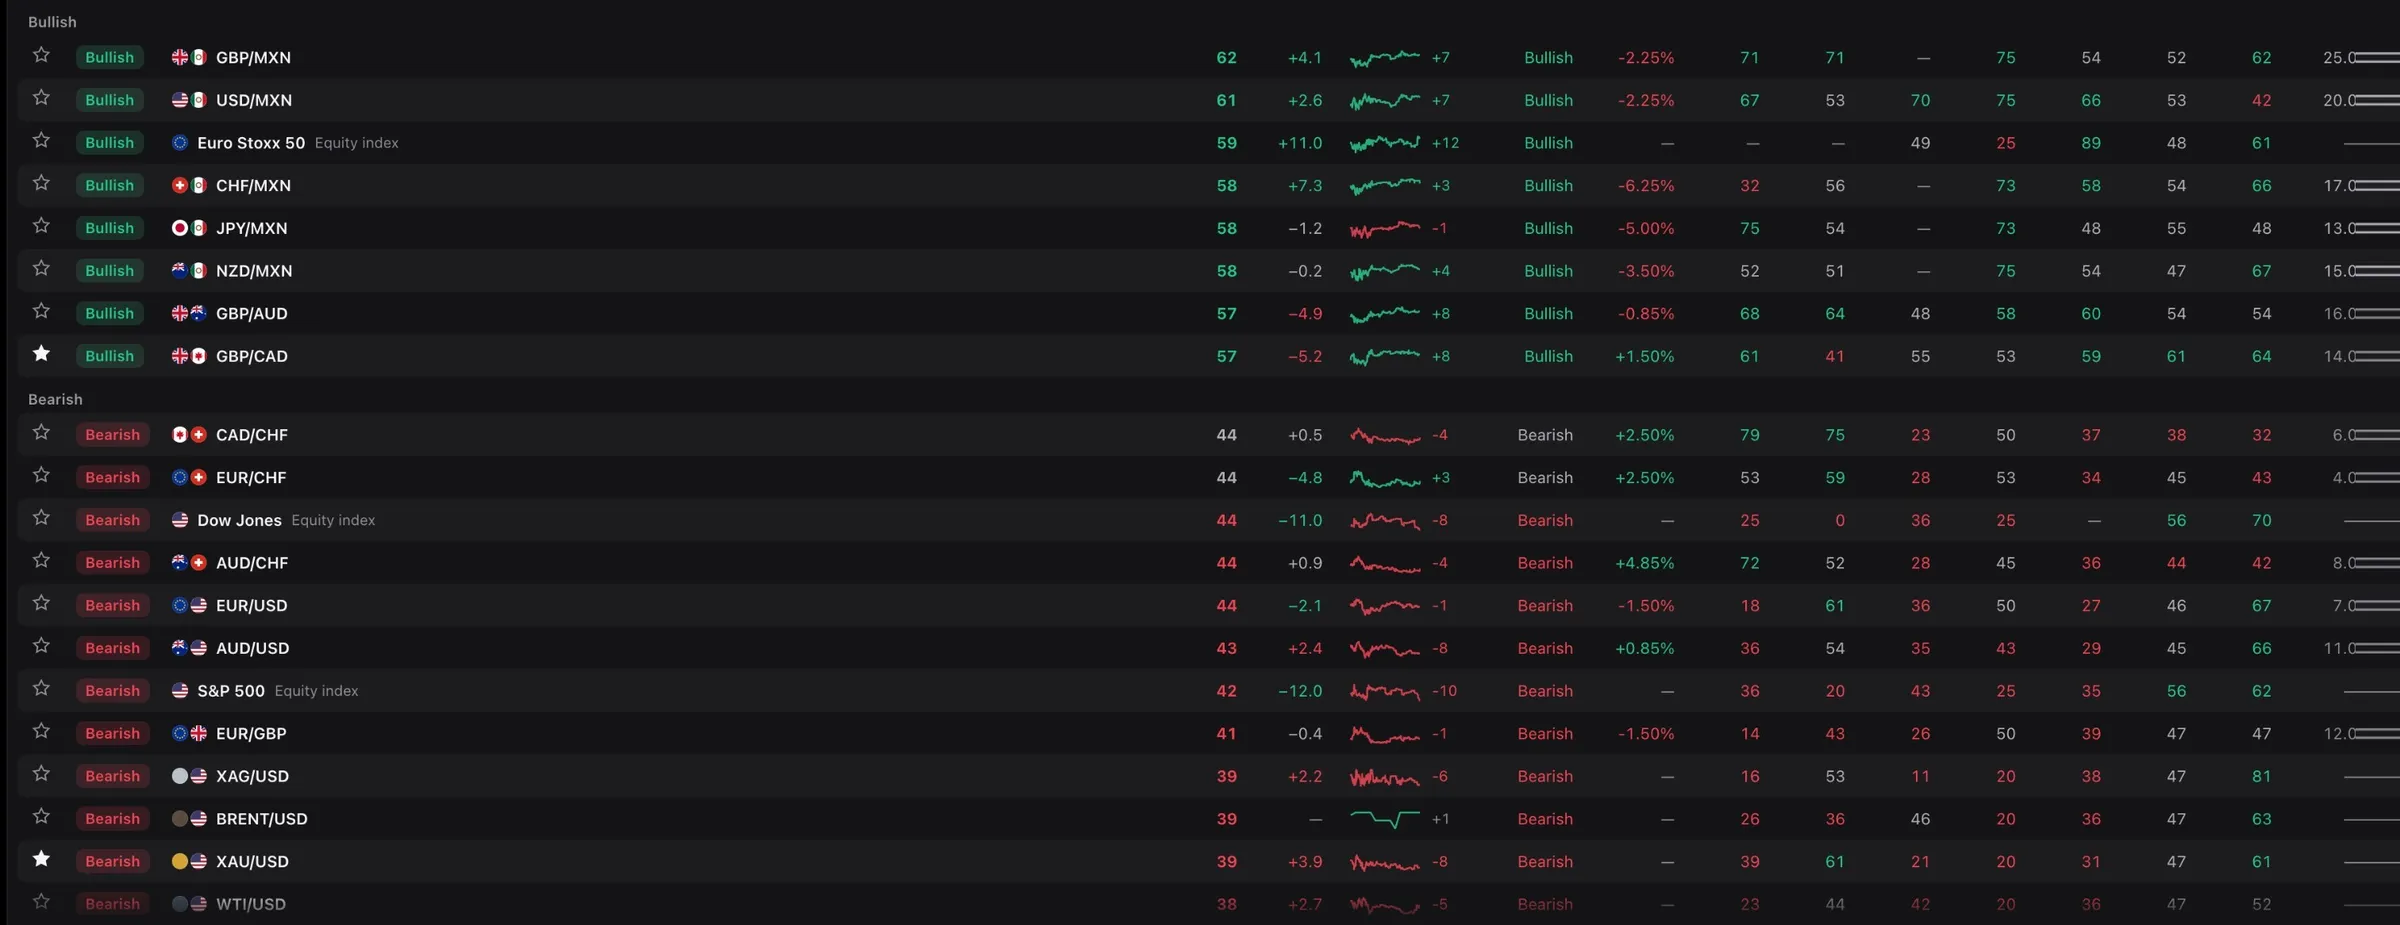
Trade scannerFX, commodities, indices, ranked
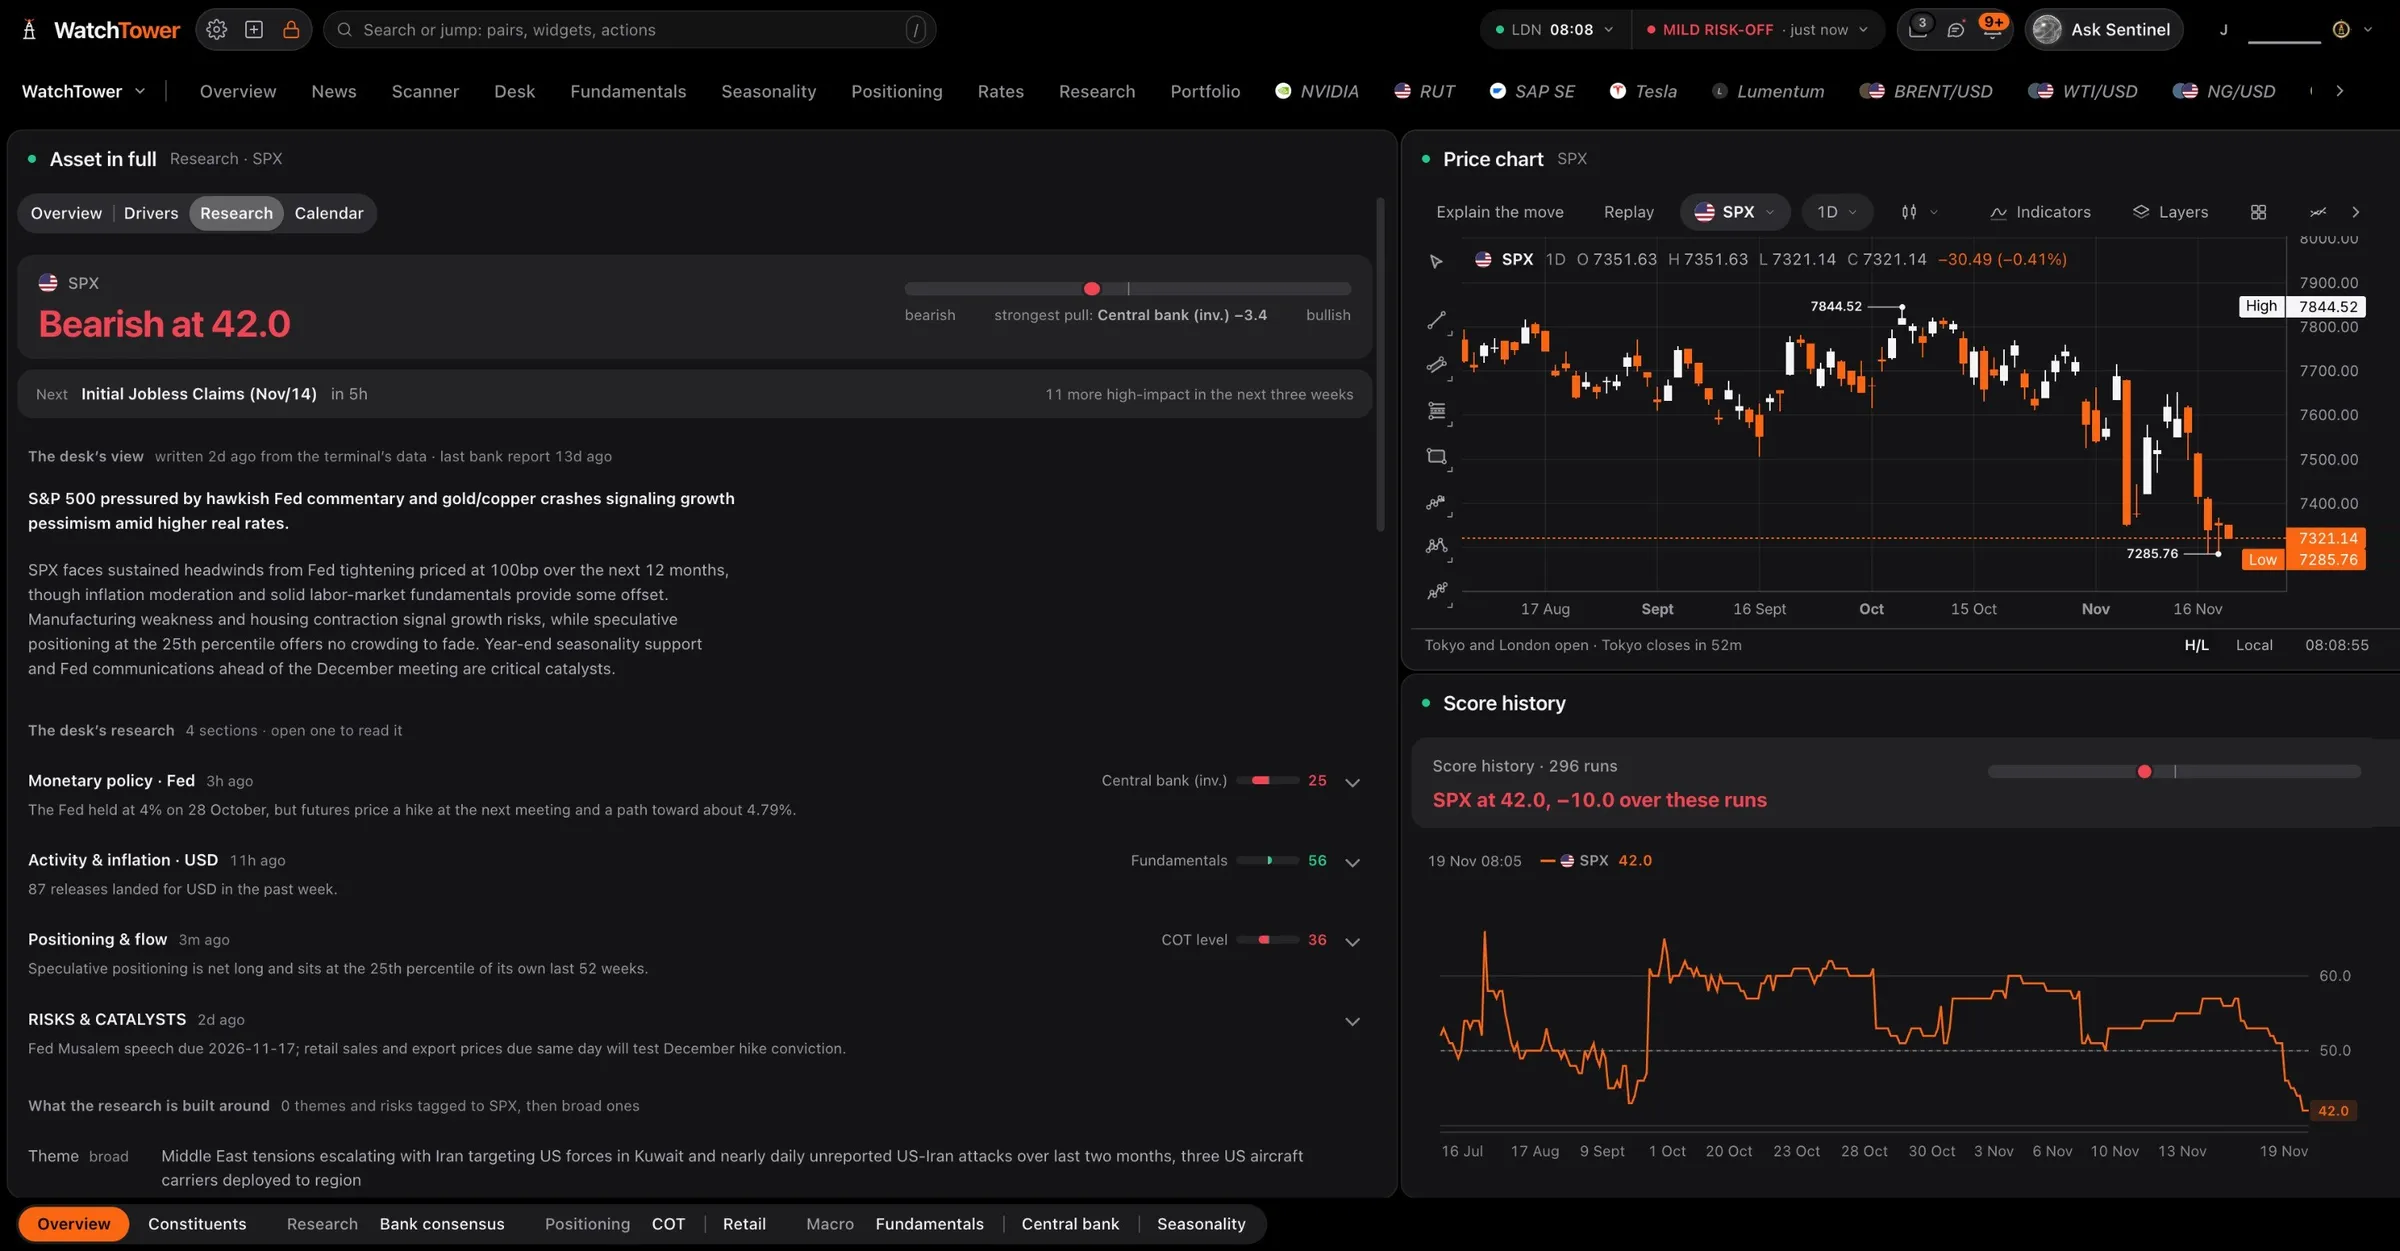
S&P 500 in fullThe score, the desk’s view and the research
Its 500 stocksThe market map, breadth and sectors
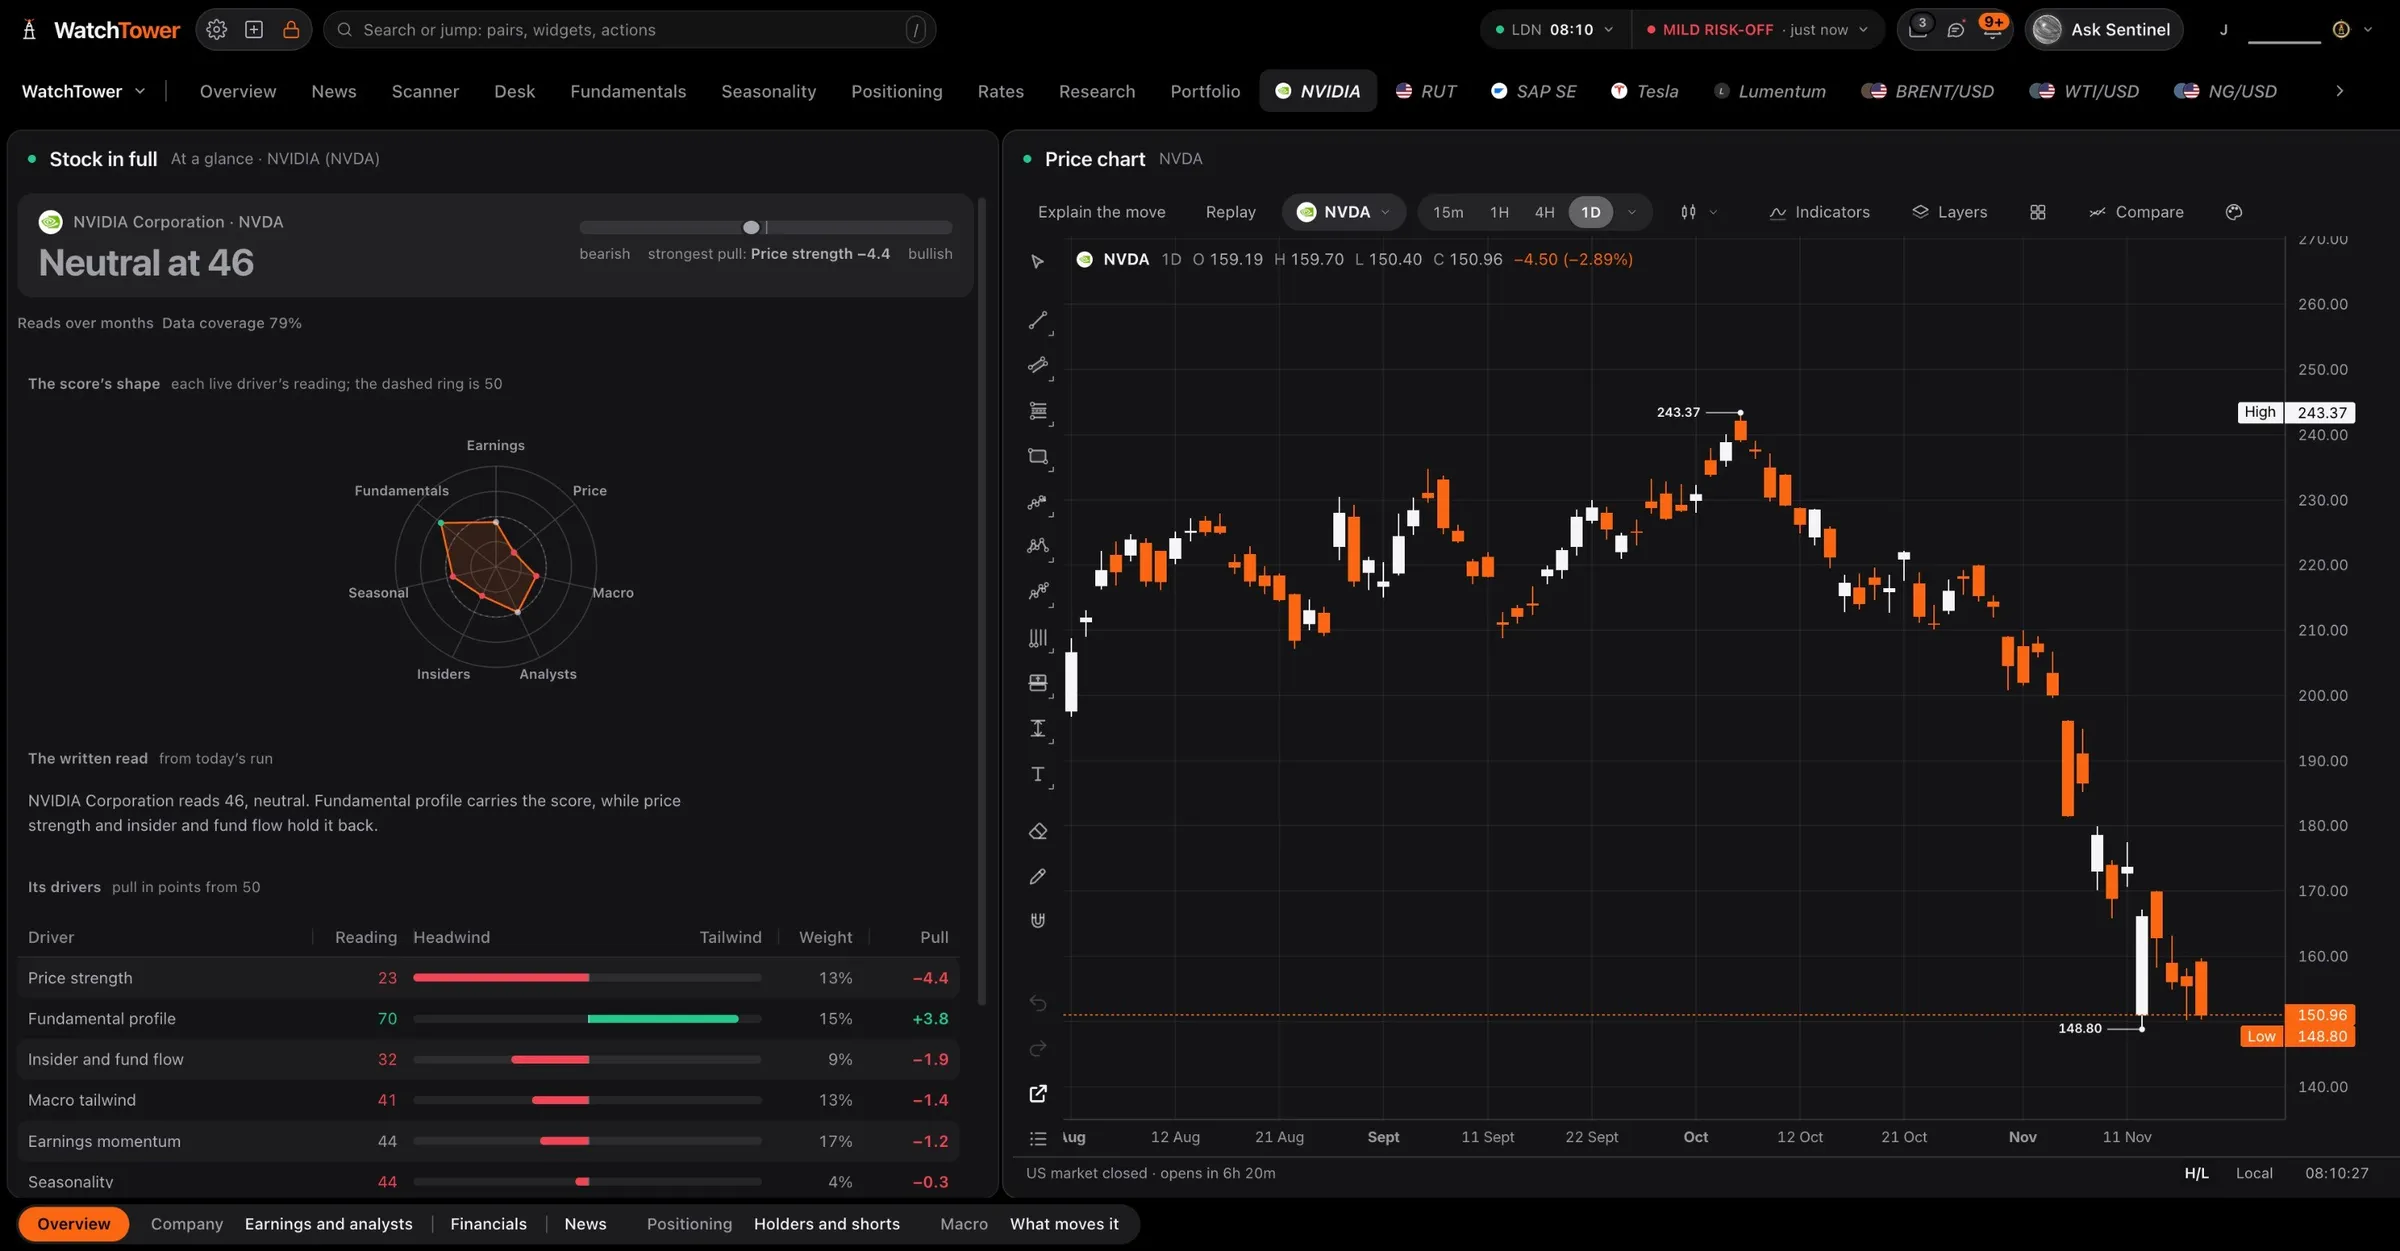
NVIDIA in fullEvery stock scored on its drivers
Earnings and analystsEvery report, every grade change
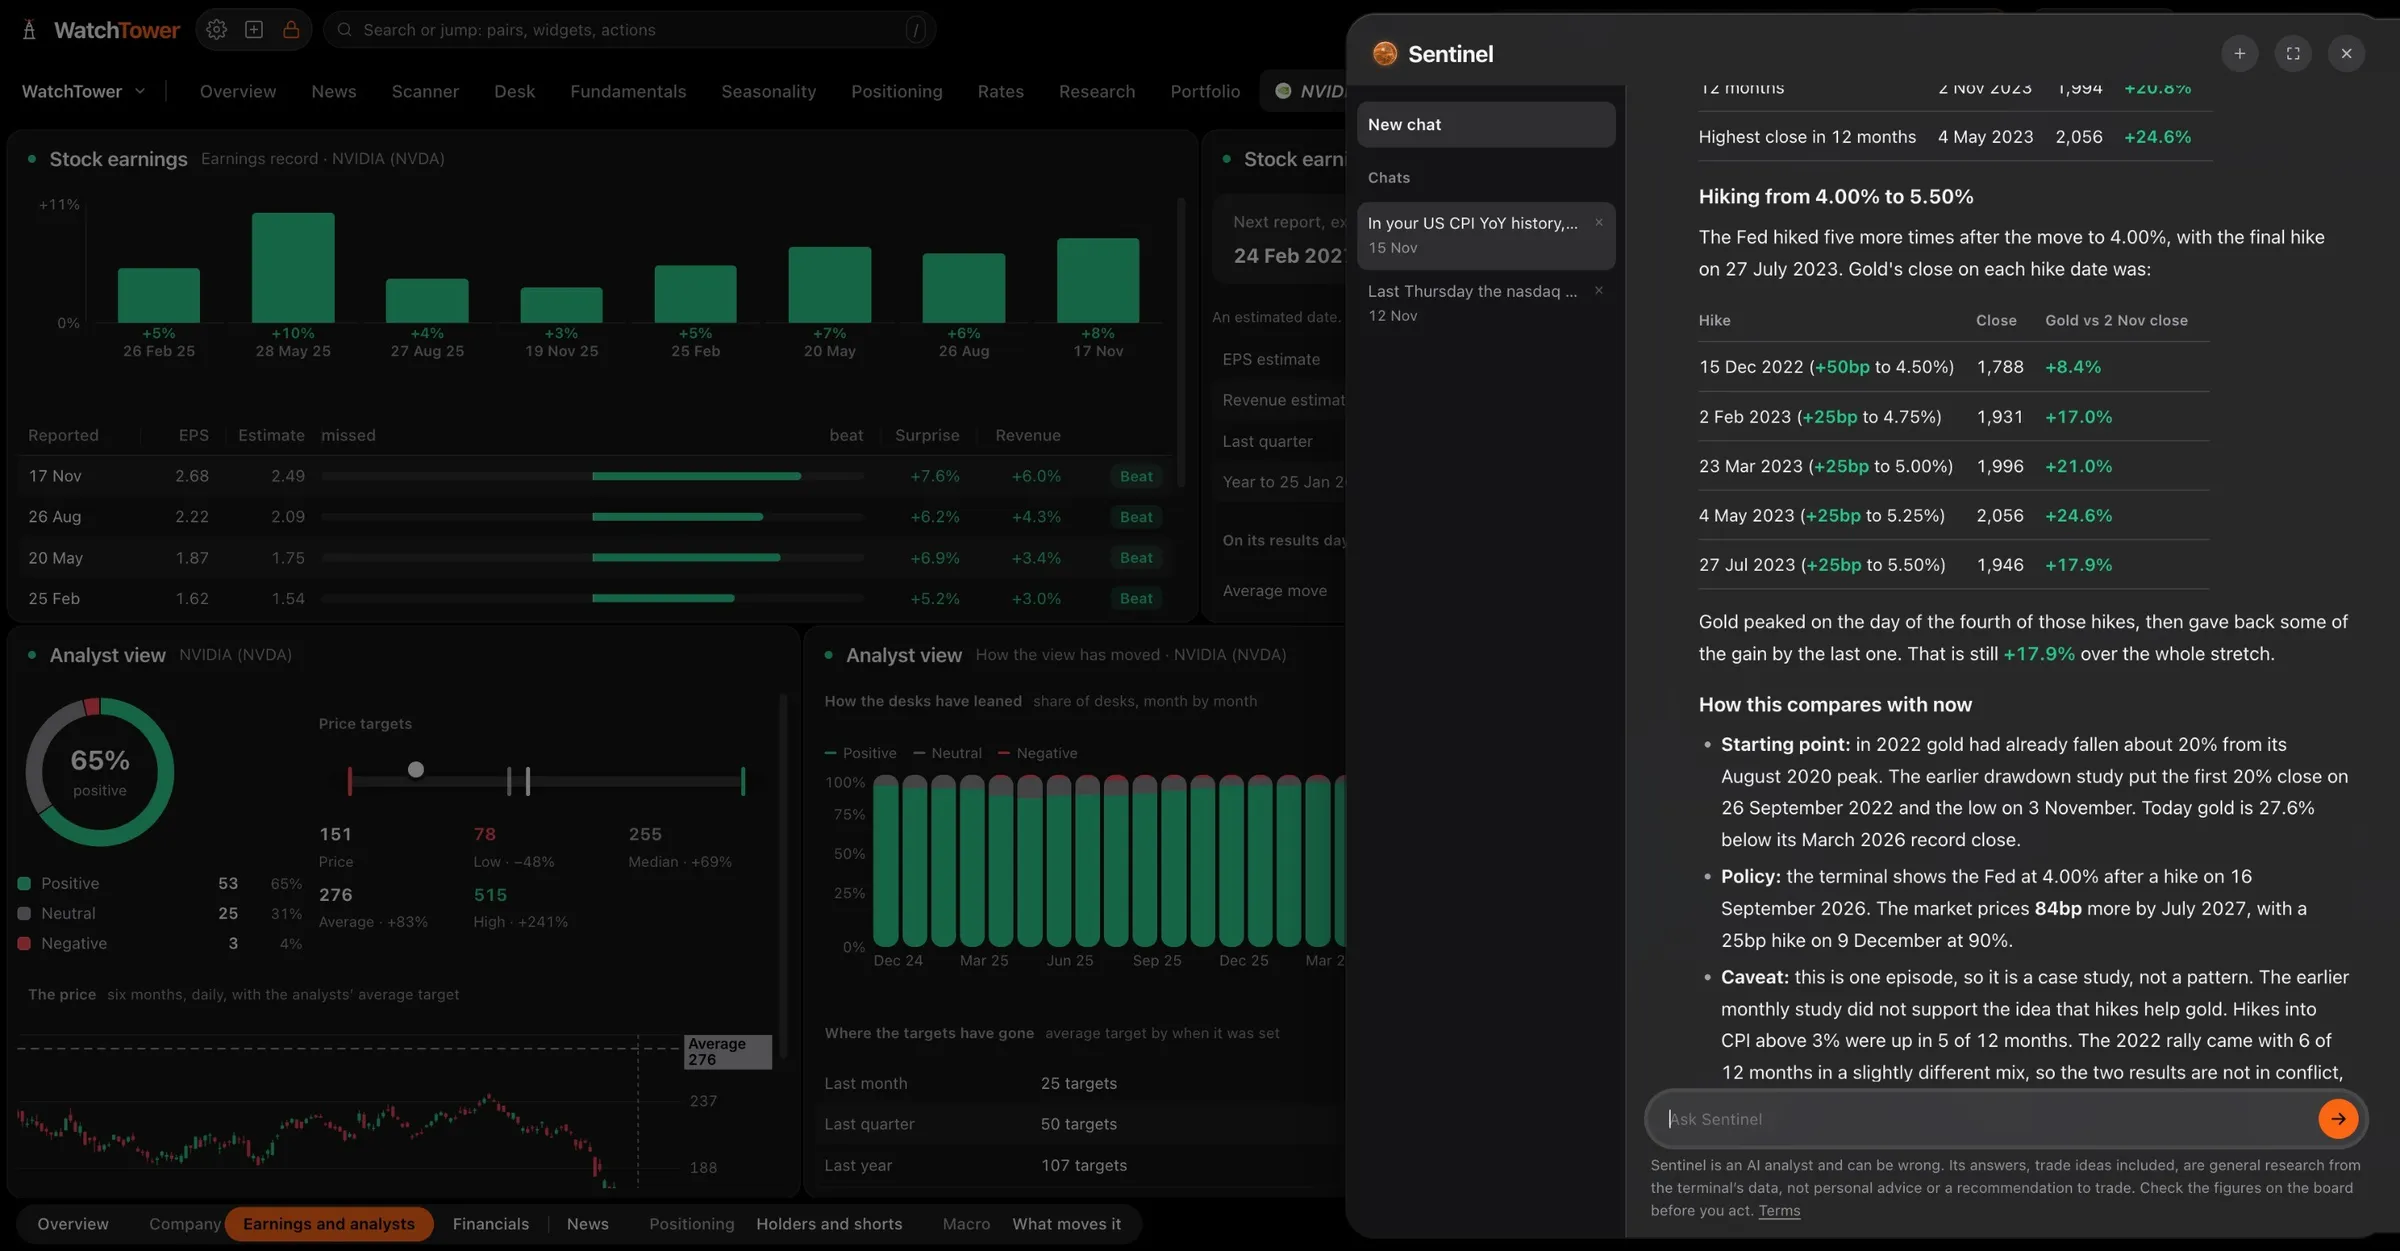
SentinelAsk a question, get the study
What goes into a stock's score
Nine parts. Inside the terminal, each stock shows every one of them, its weight and how hard it is pulling the score.
- Earnings momentum
- How the company has done against what analysts expected, quarter after quarter.
- Estimate revisions
- Which way analysts are moving their forecasts for the quarters ahead.
- Price strength
- Its trend and how it is doing against its benchmark.
- Macro tailwind
- Our own score for the index it belongs to, with its currency and oil. This is where the macro read of the board reaches a single stock.
- Analyst view
- Recent rating changes, the consensus and where analysts' price expectations sit against today's price.
- Positioning
- How crowded the trade is. This part isn't live yet, so for now it drops out and the others carry the score.
- Insider and fund flow
- For US names, what insiders file and what the large funds hold.
- Seasonality
- How it has tended to behave at this time of year.
- Fundamental profile
- Valuation, growth, quality and the balance sheet, each read from the accounts as they stood on the day they were filed. Banks and insurers are read on the measures that fit their books.
The rules every score follows
The same rules as our market scores, so a stock and its index read on one scale.
- A fixed scale
- Every part is read from 0 to 100 on a fixed scale, so a 70 means the same thing next month as it does today.
- Missing parts are shown
- When a part has no data, it drops out, the rest are reweighted and the stock shows how much of the model is live.
- Earnings week
- Within two trading days of a result, the score is pulled towards neutral while the market digests the numbers.
- Read against its own market
- A European or Japanese stock is read against its home index, its currency and oil. The parts built on US filings are marked as not applicable, so they never count against it.
- The same bands as every market
- Above 56 reads bullish, below 45 bearish, the bands used across the whole board.
Rank them in the scanner
Switch the Trade scanner to stocks and it ranks them on the same drivers, next to the currencies, commodities and indices they move with.
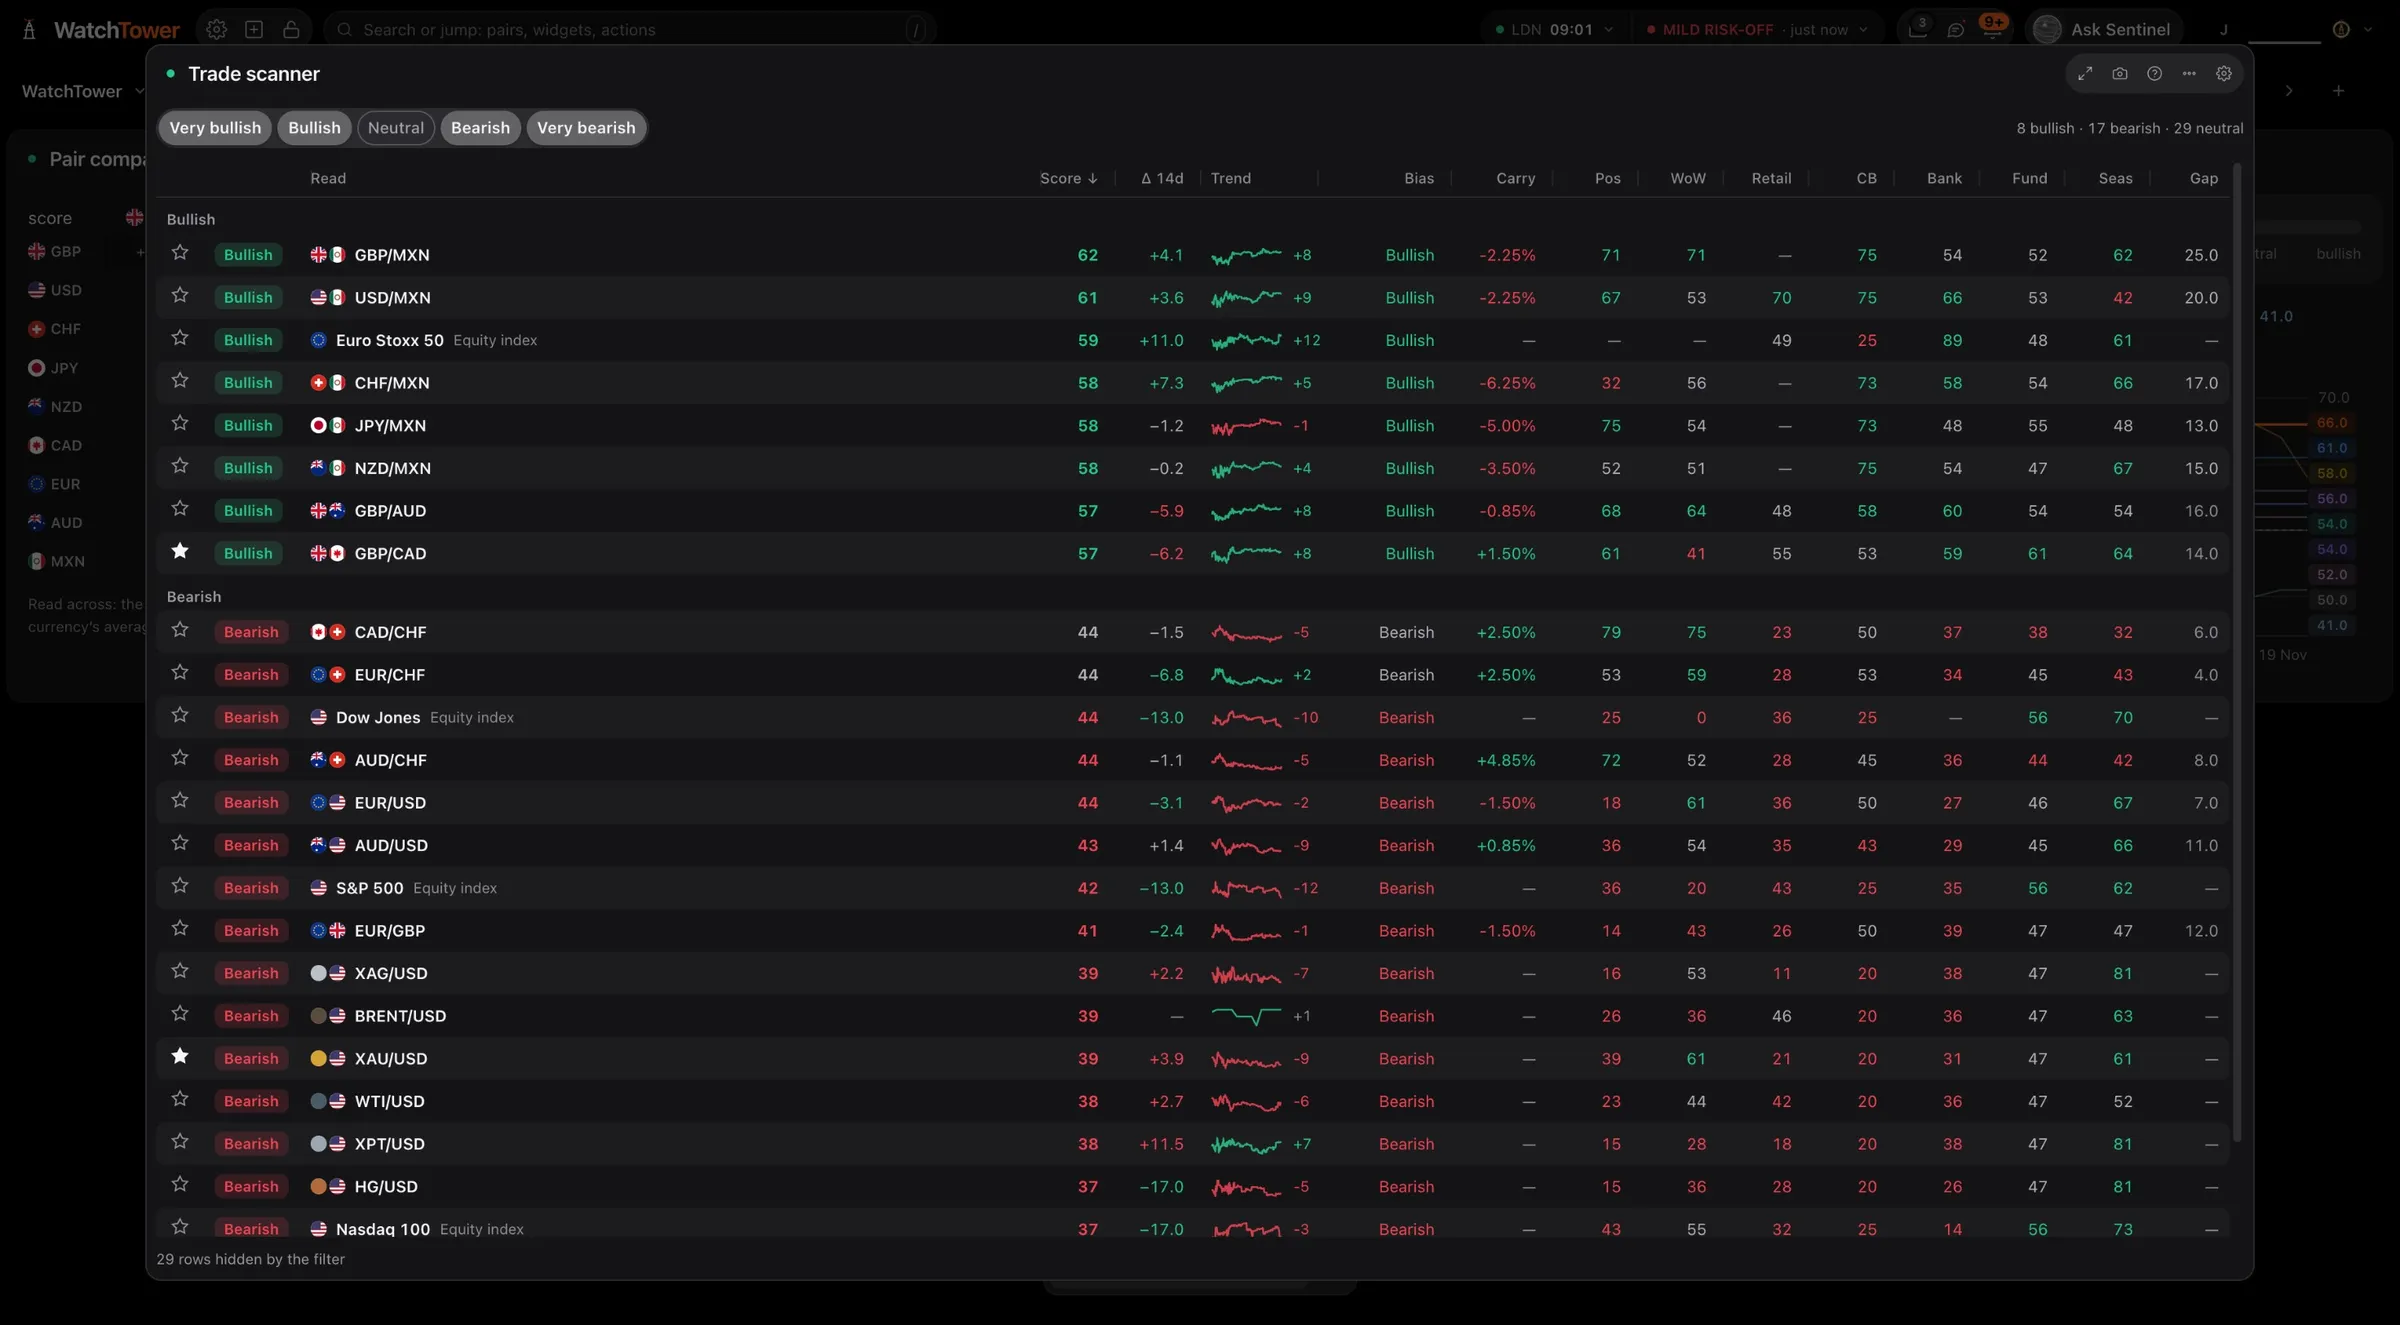
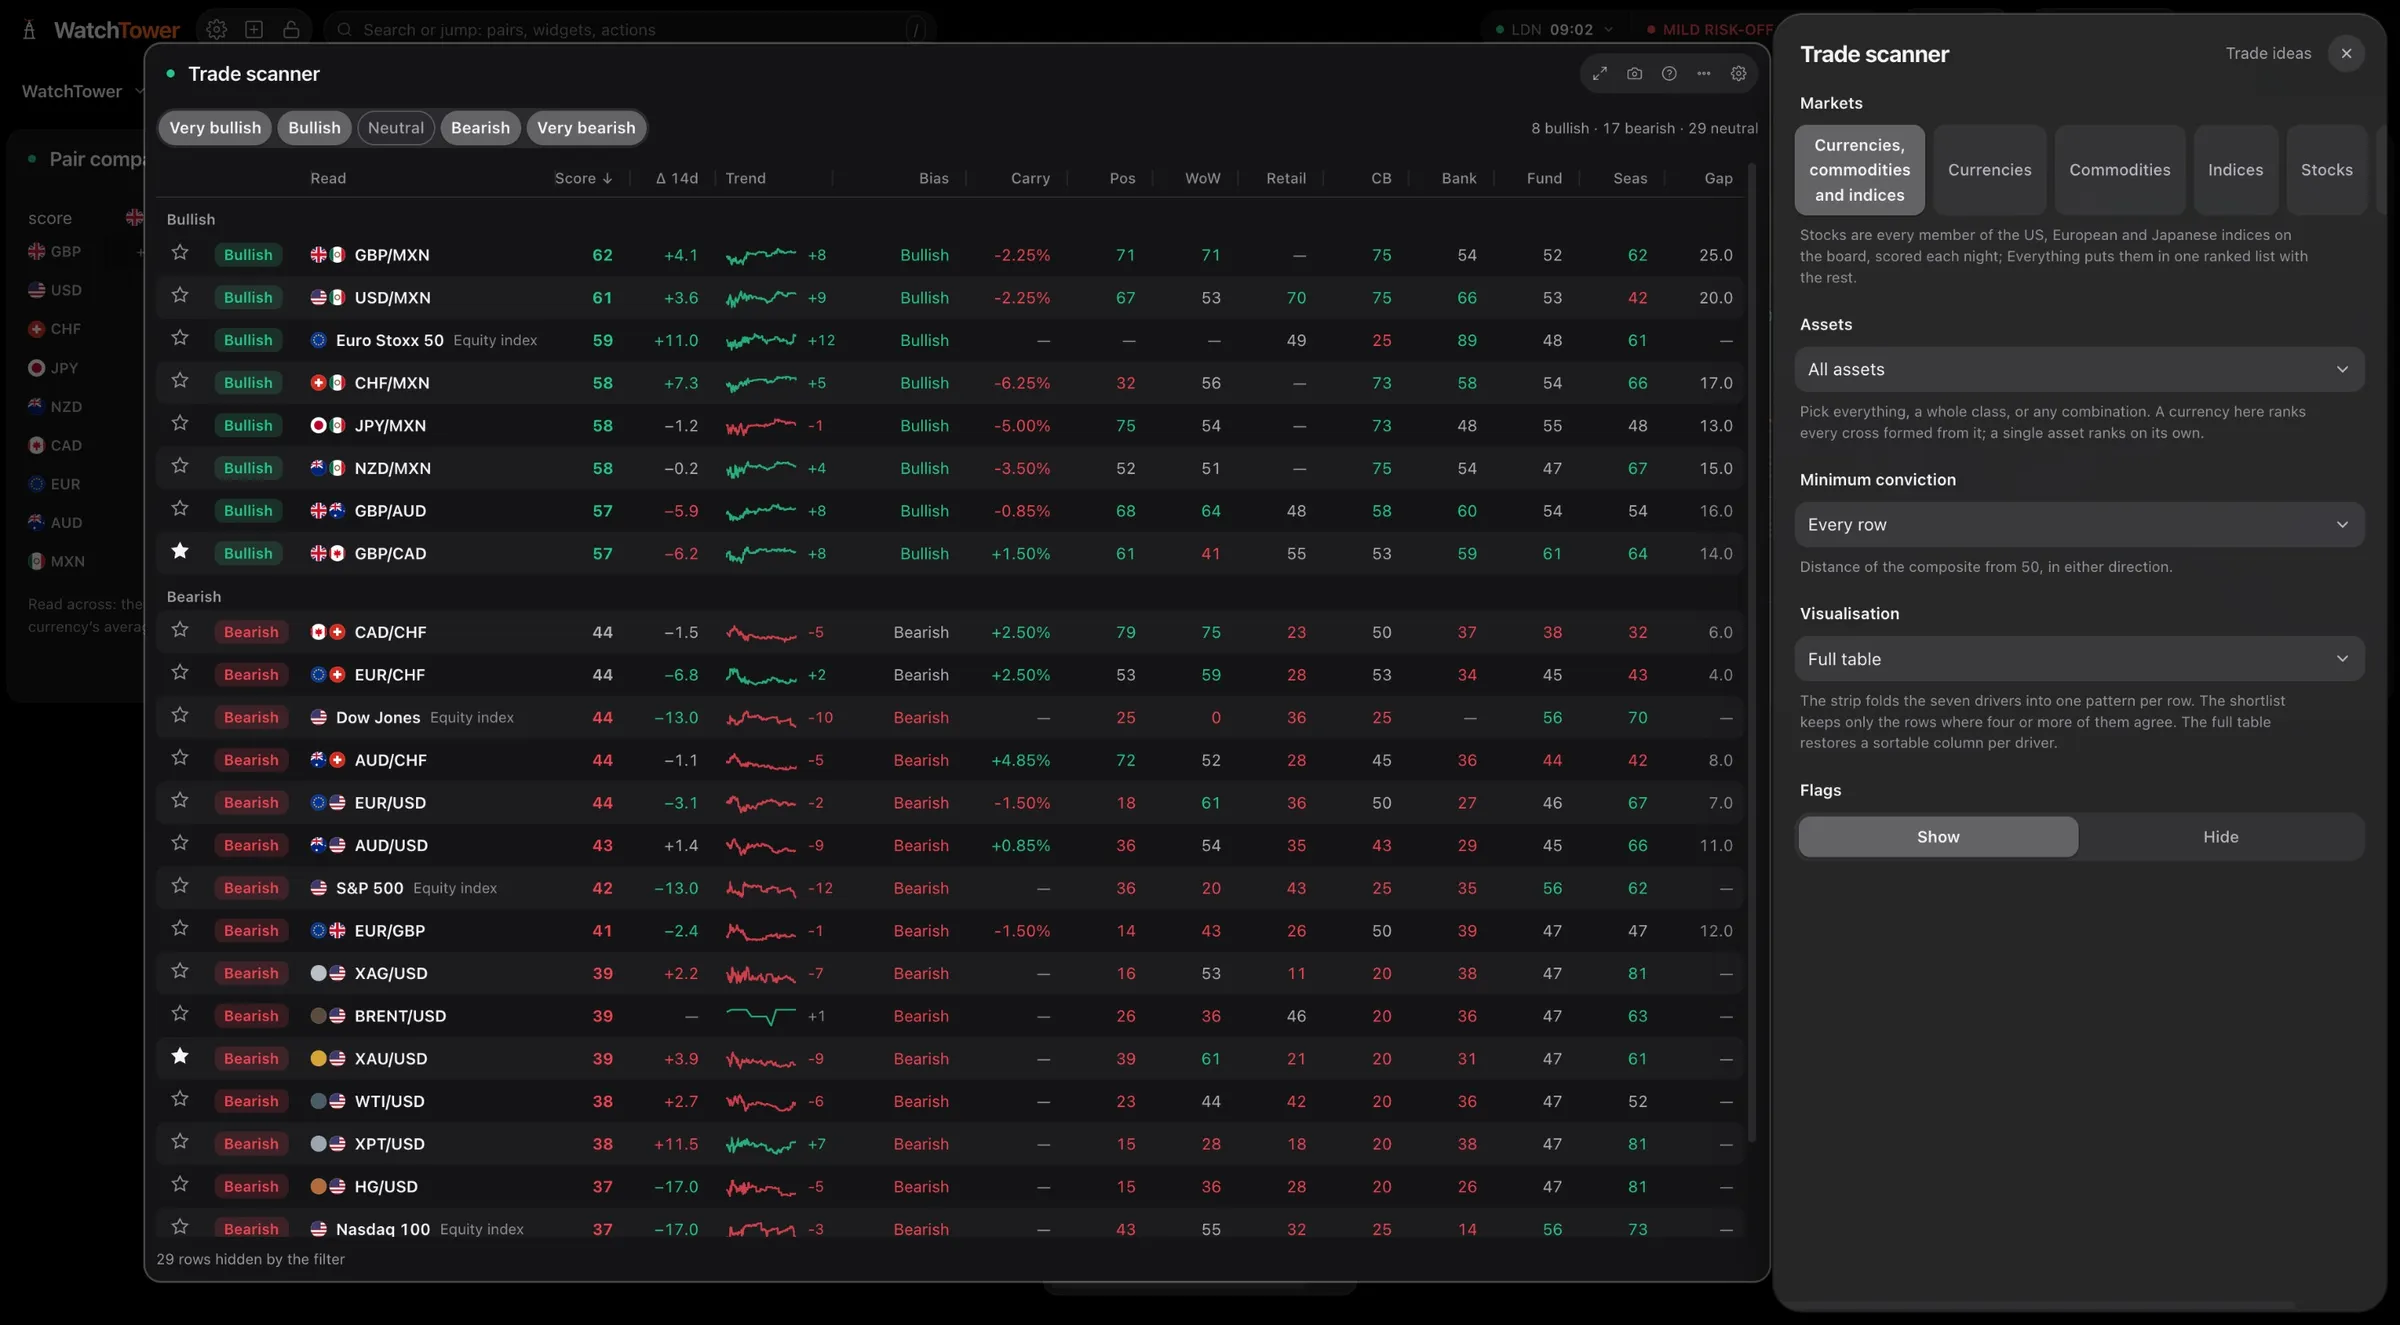
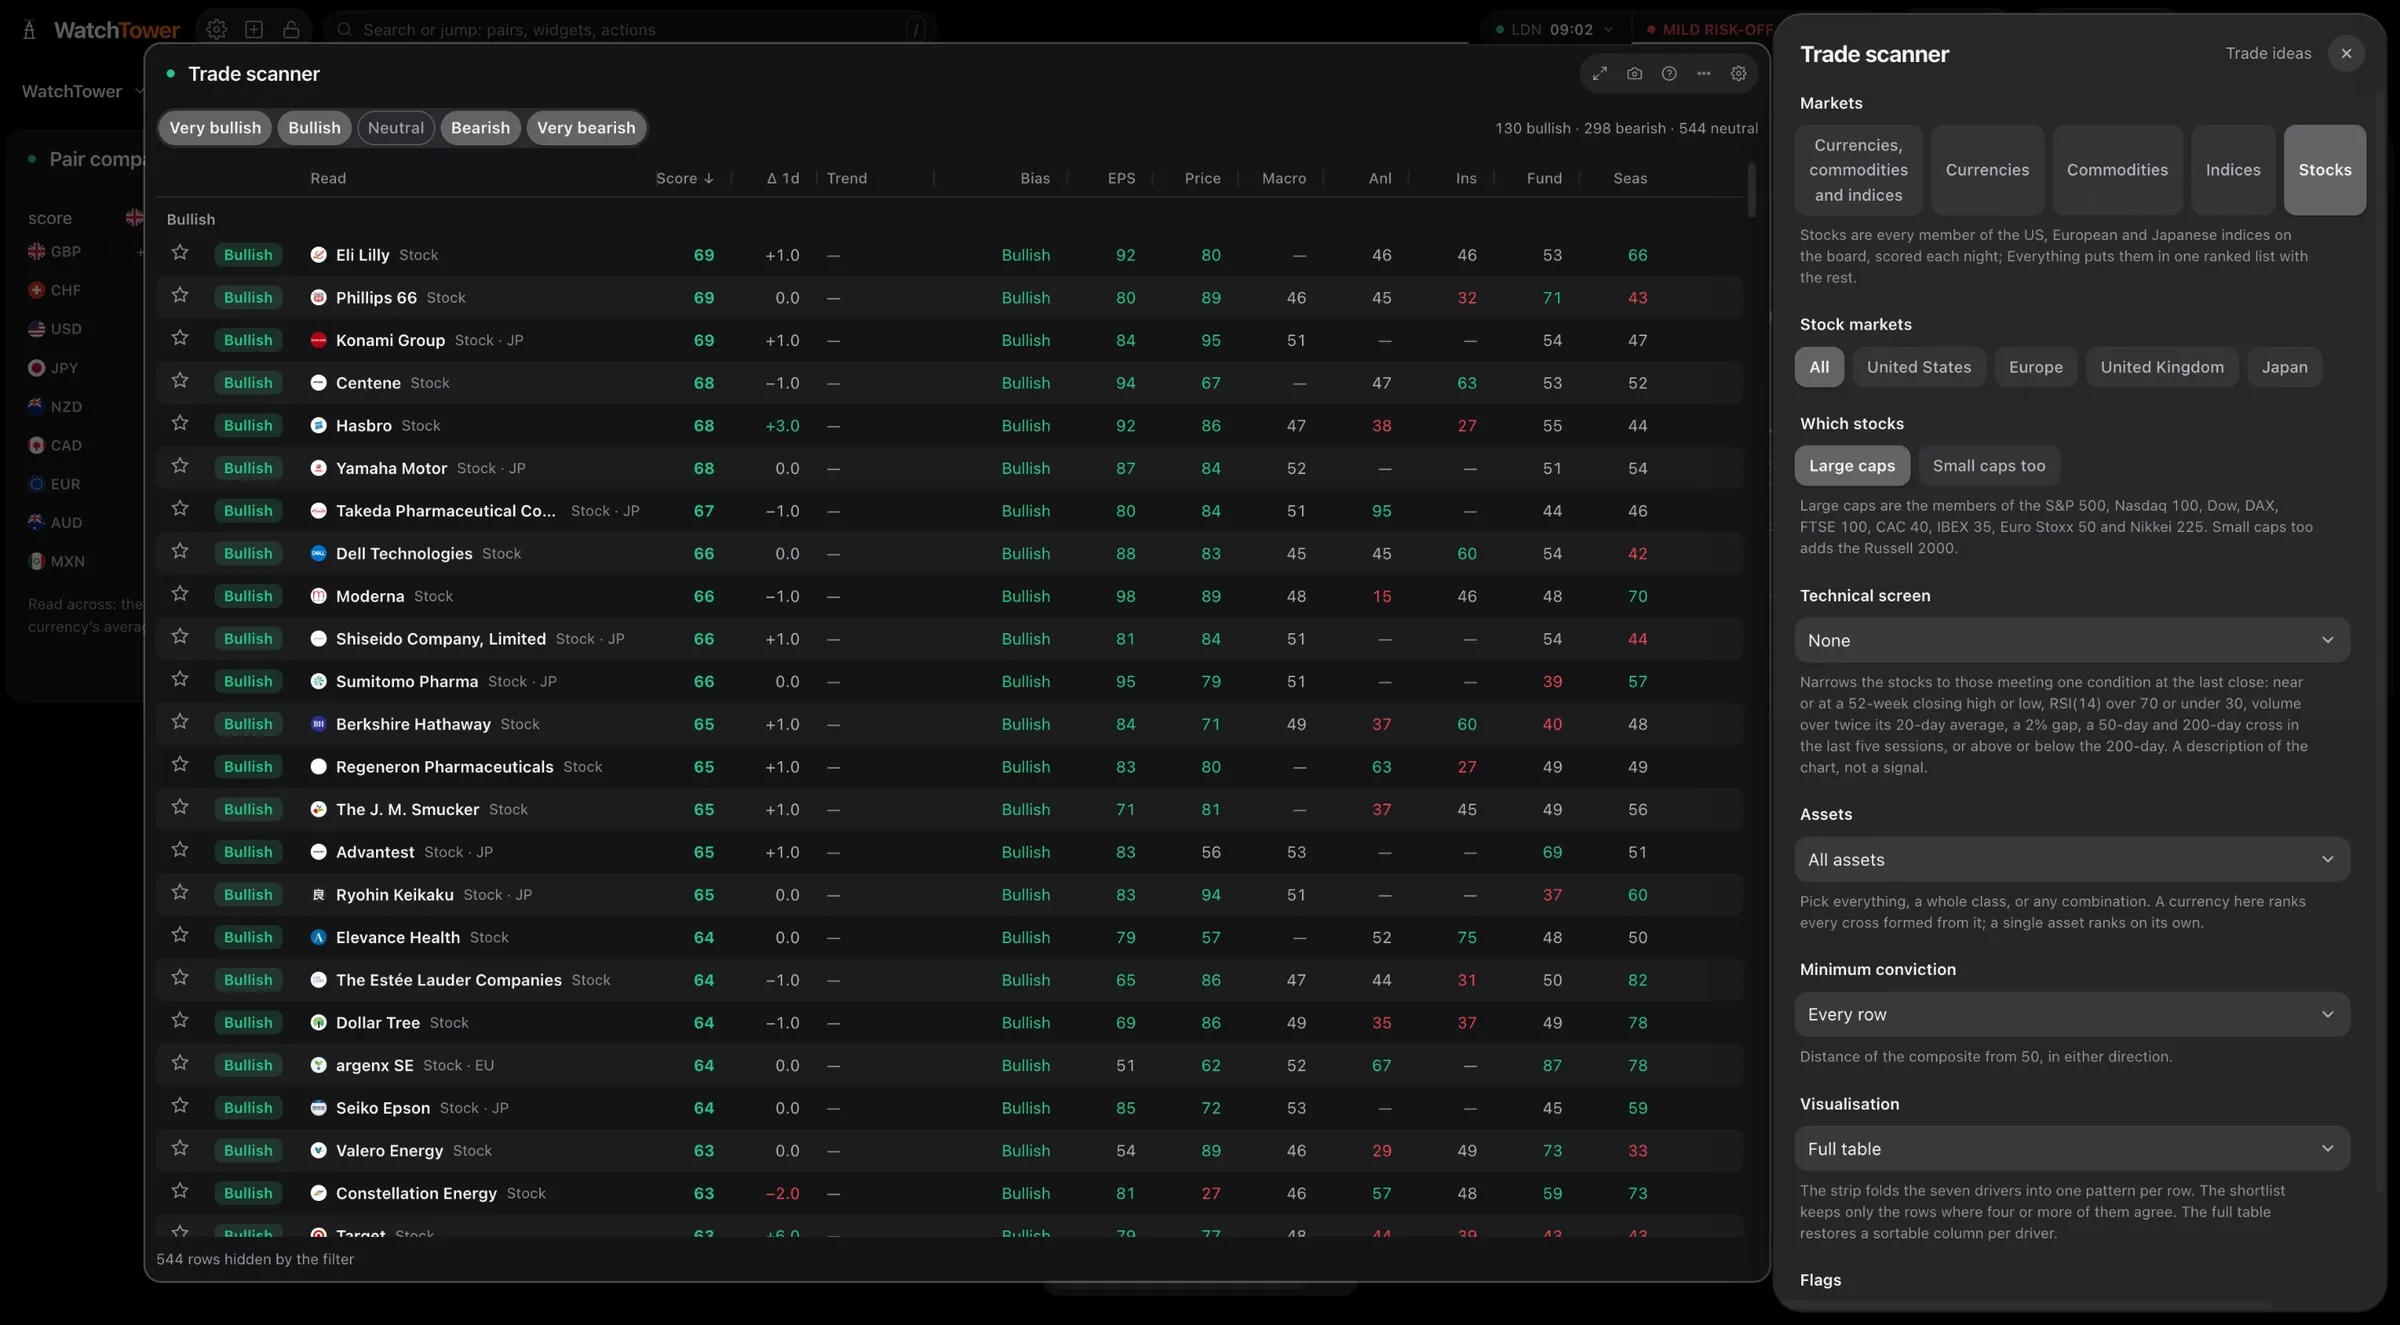
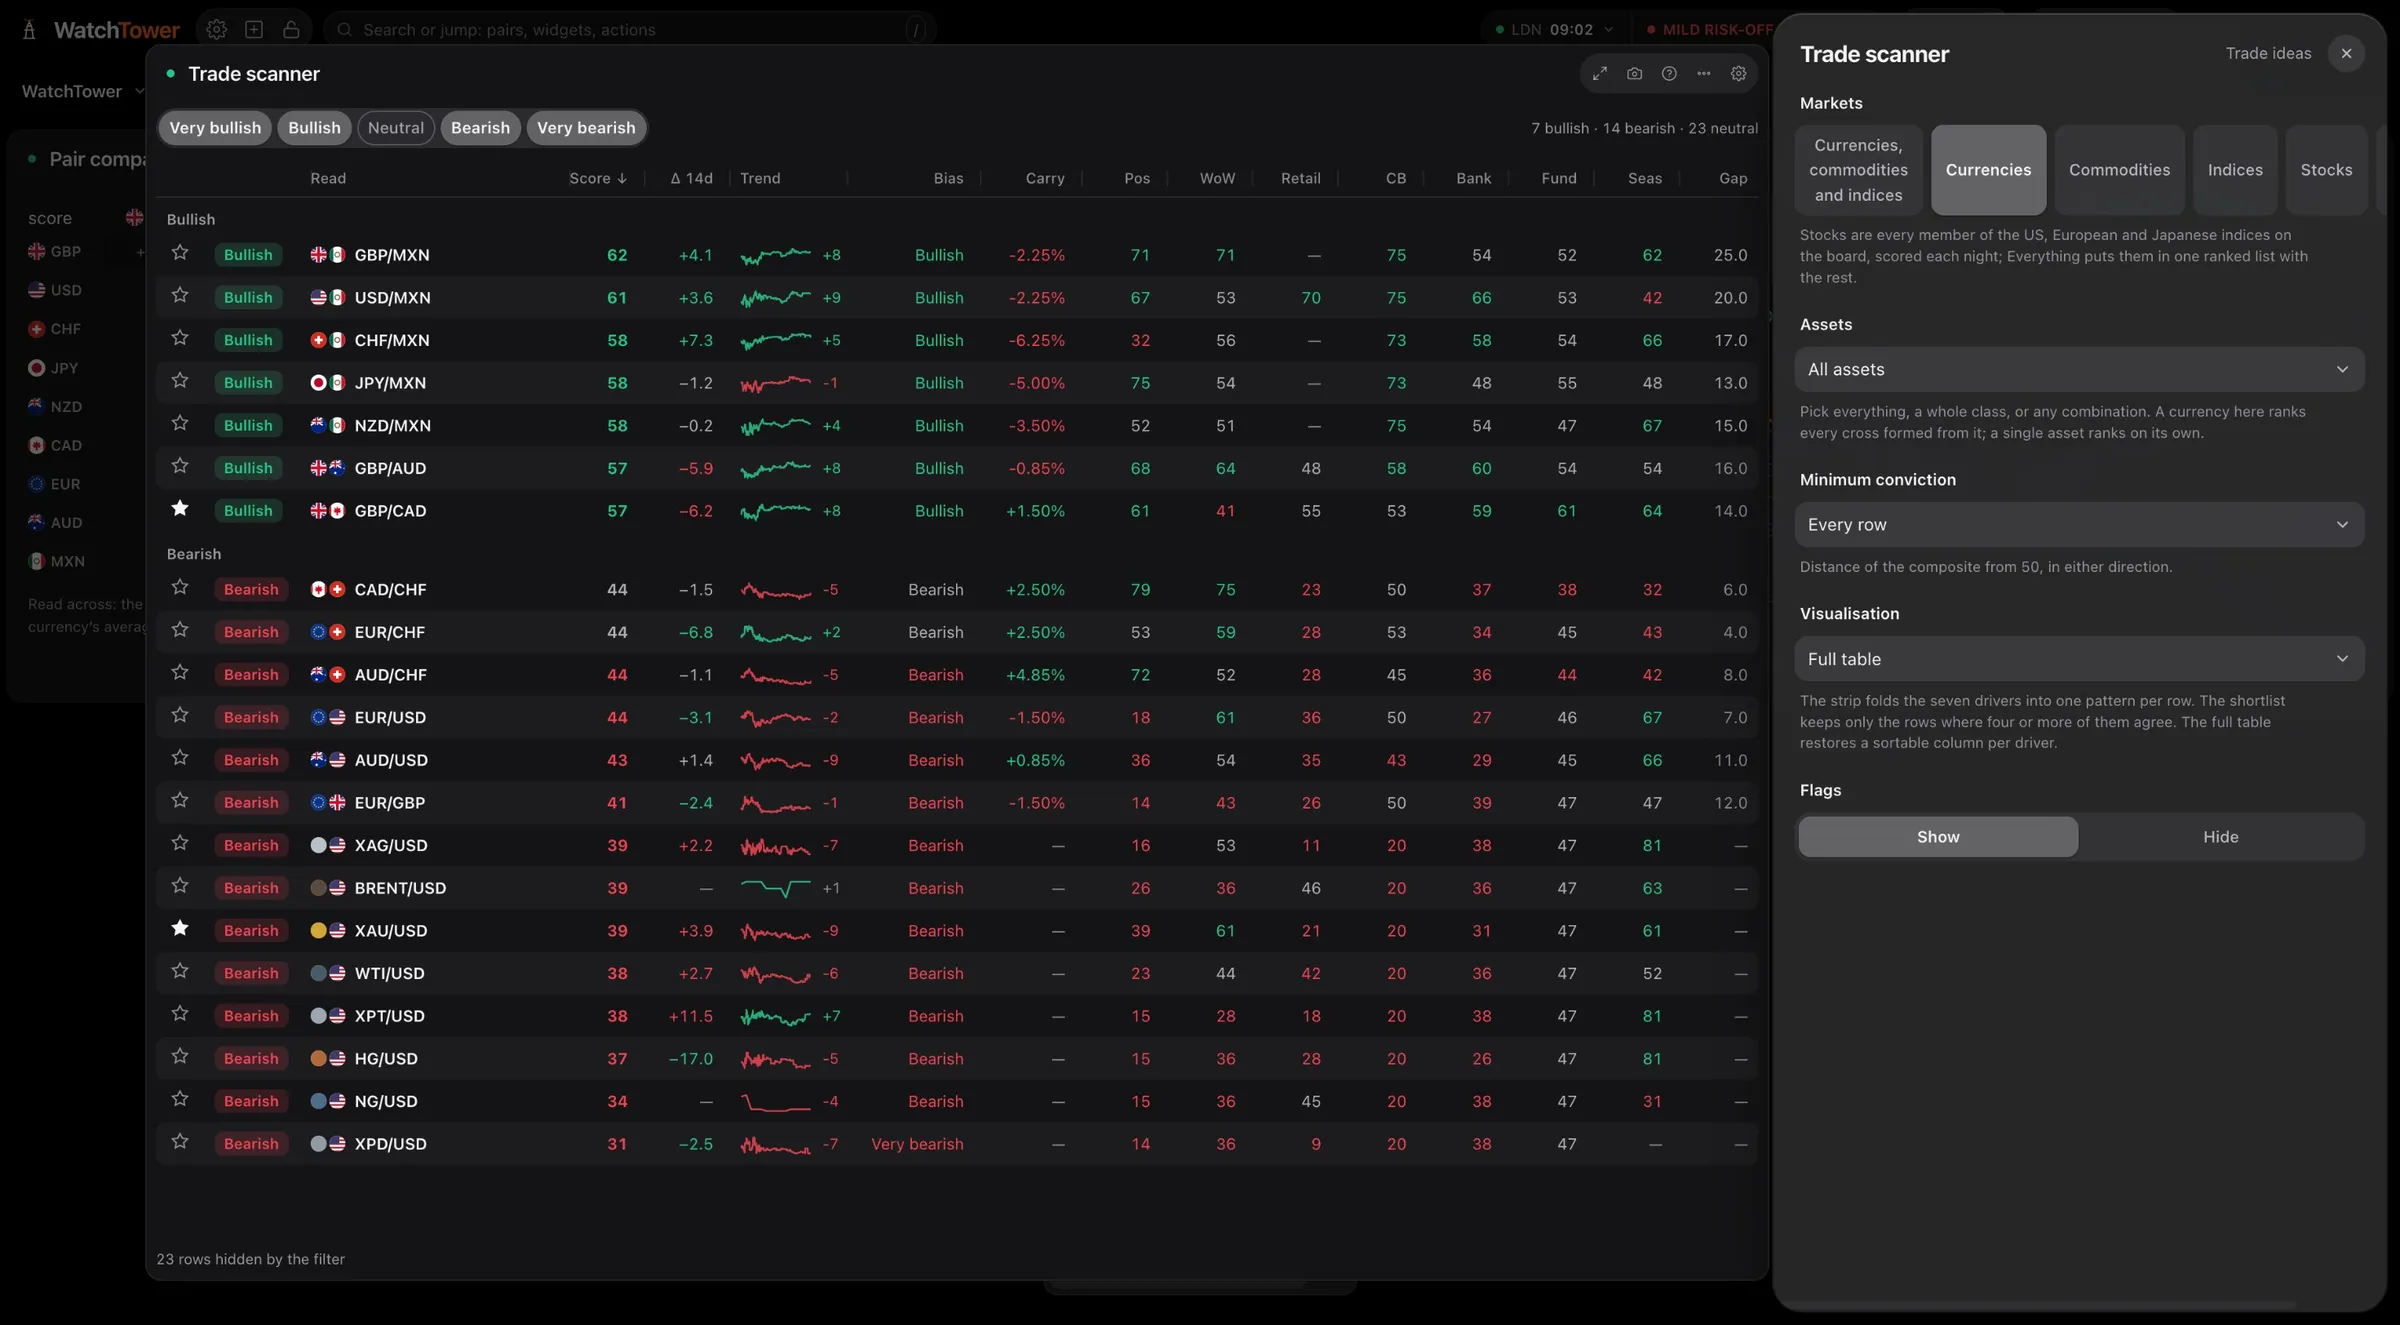
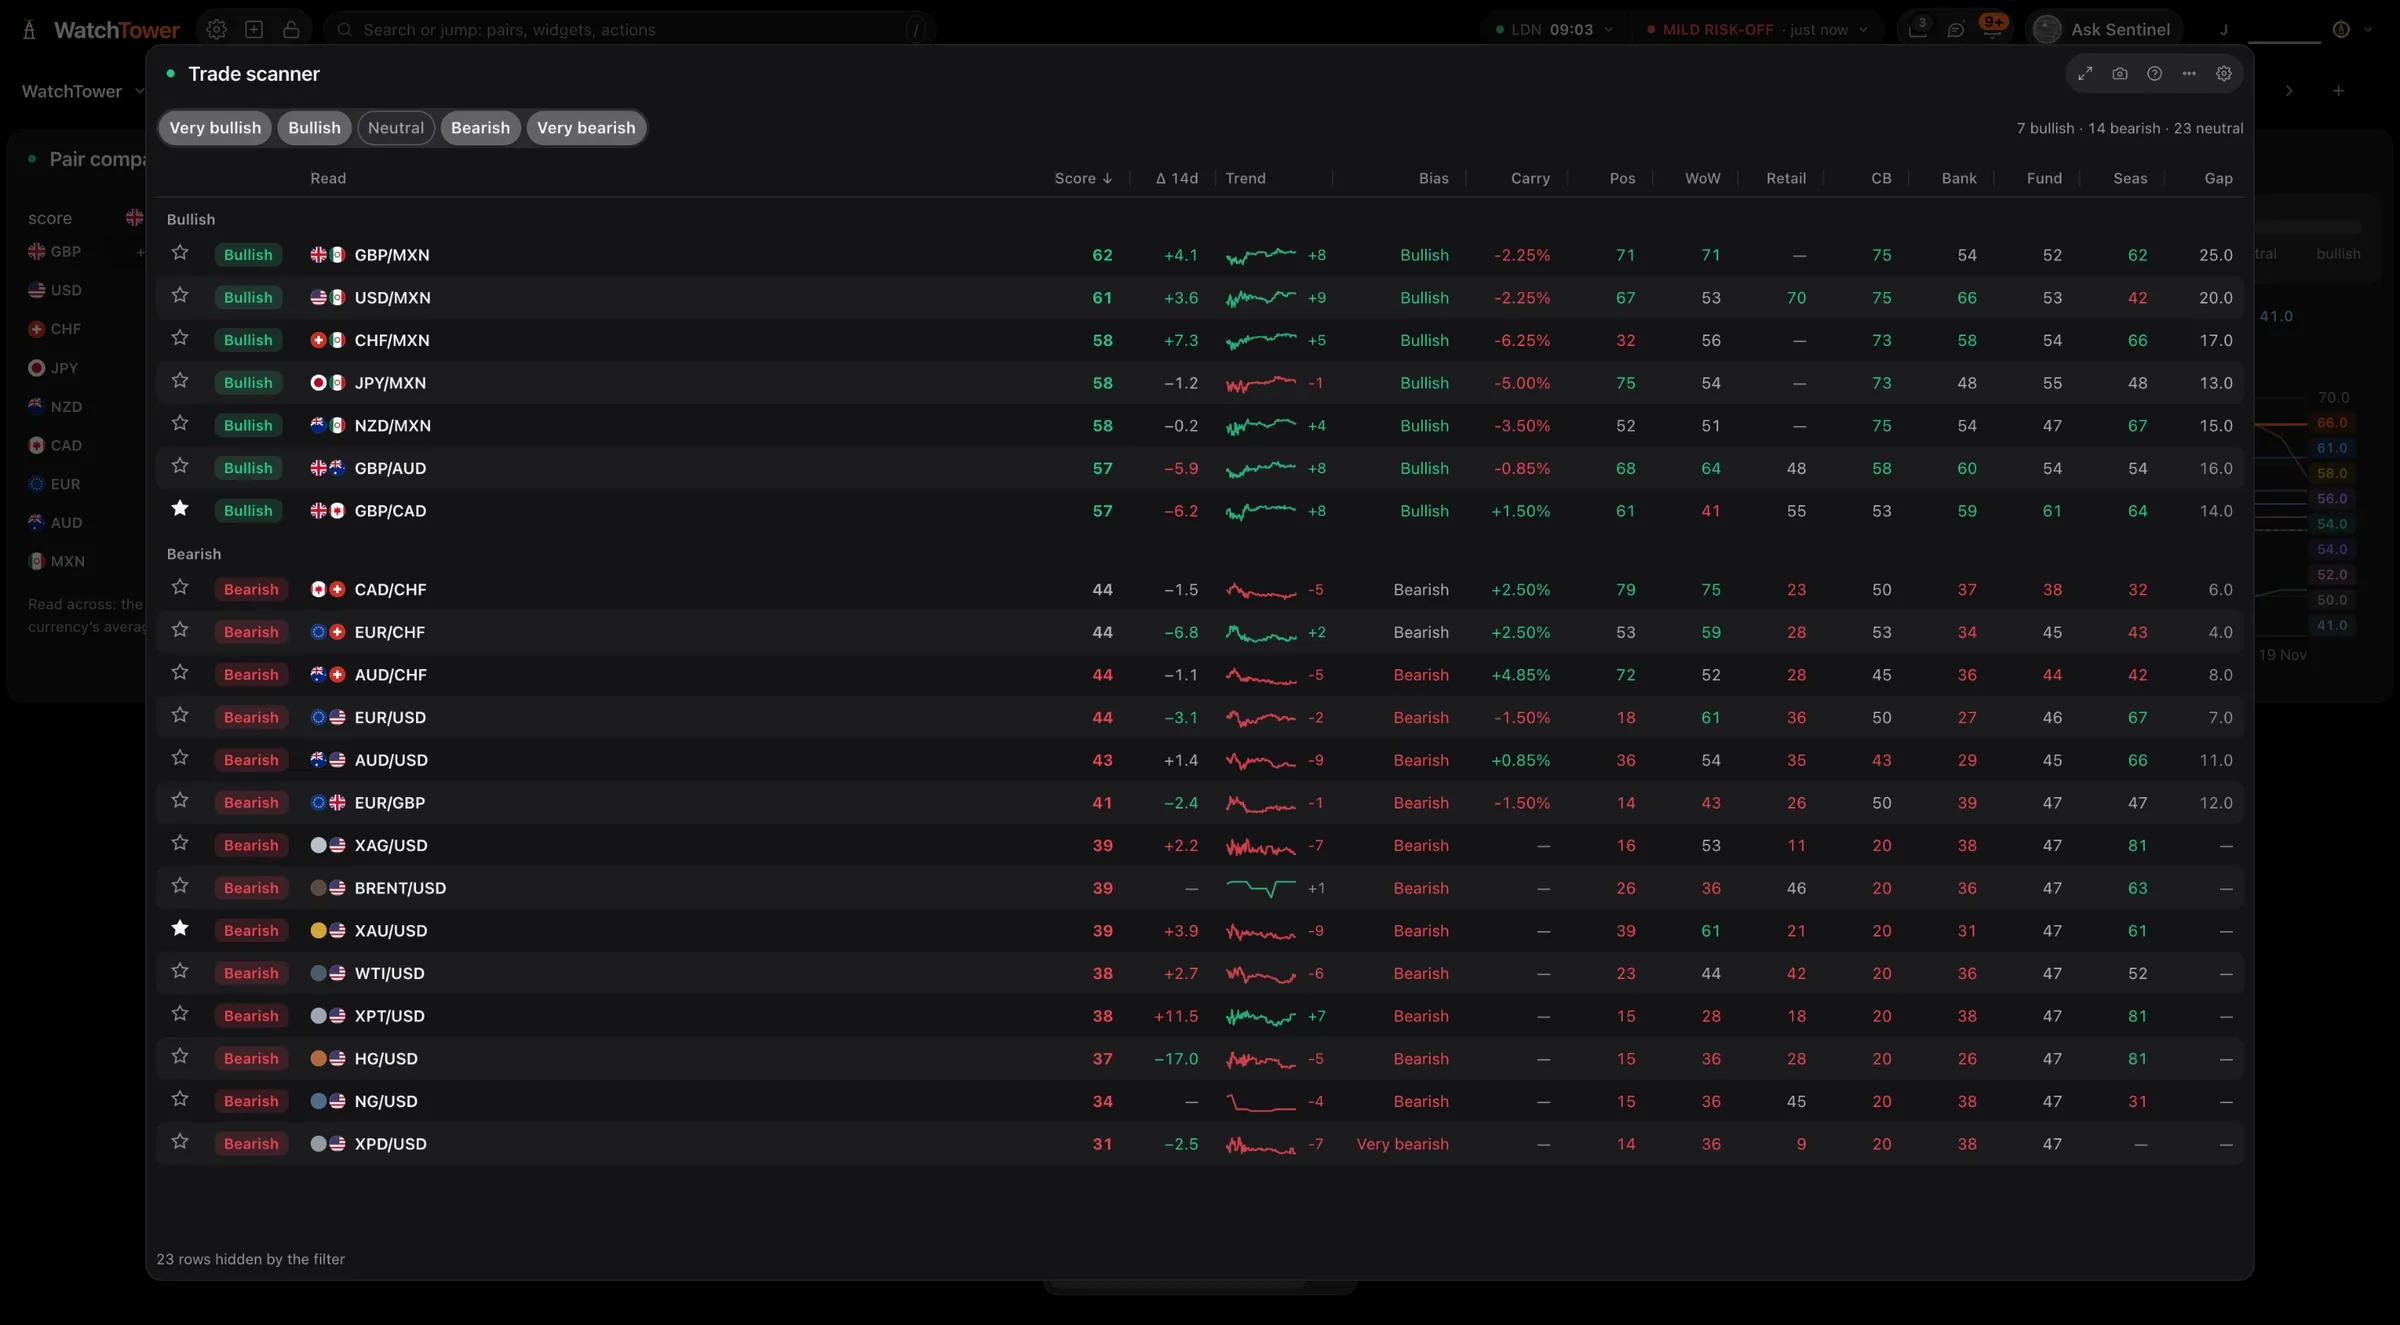
The Trade scannerCurrencies, commodities and indices, ranked on seven drivers
Pick the marketsCurrencies, commodities, indices or stocks
StocksEvery member of the US, European and Japanese indices, scored each night
CurrenciesEvery cross, with the drivers behind each score
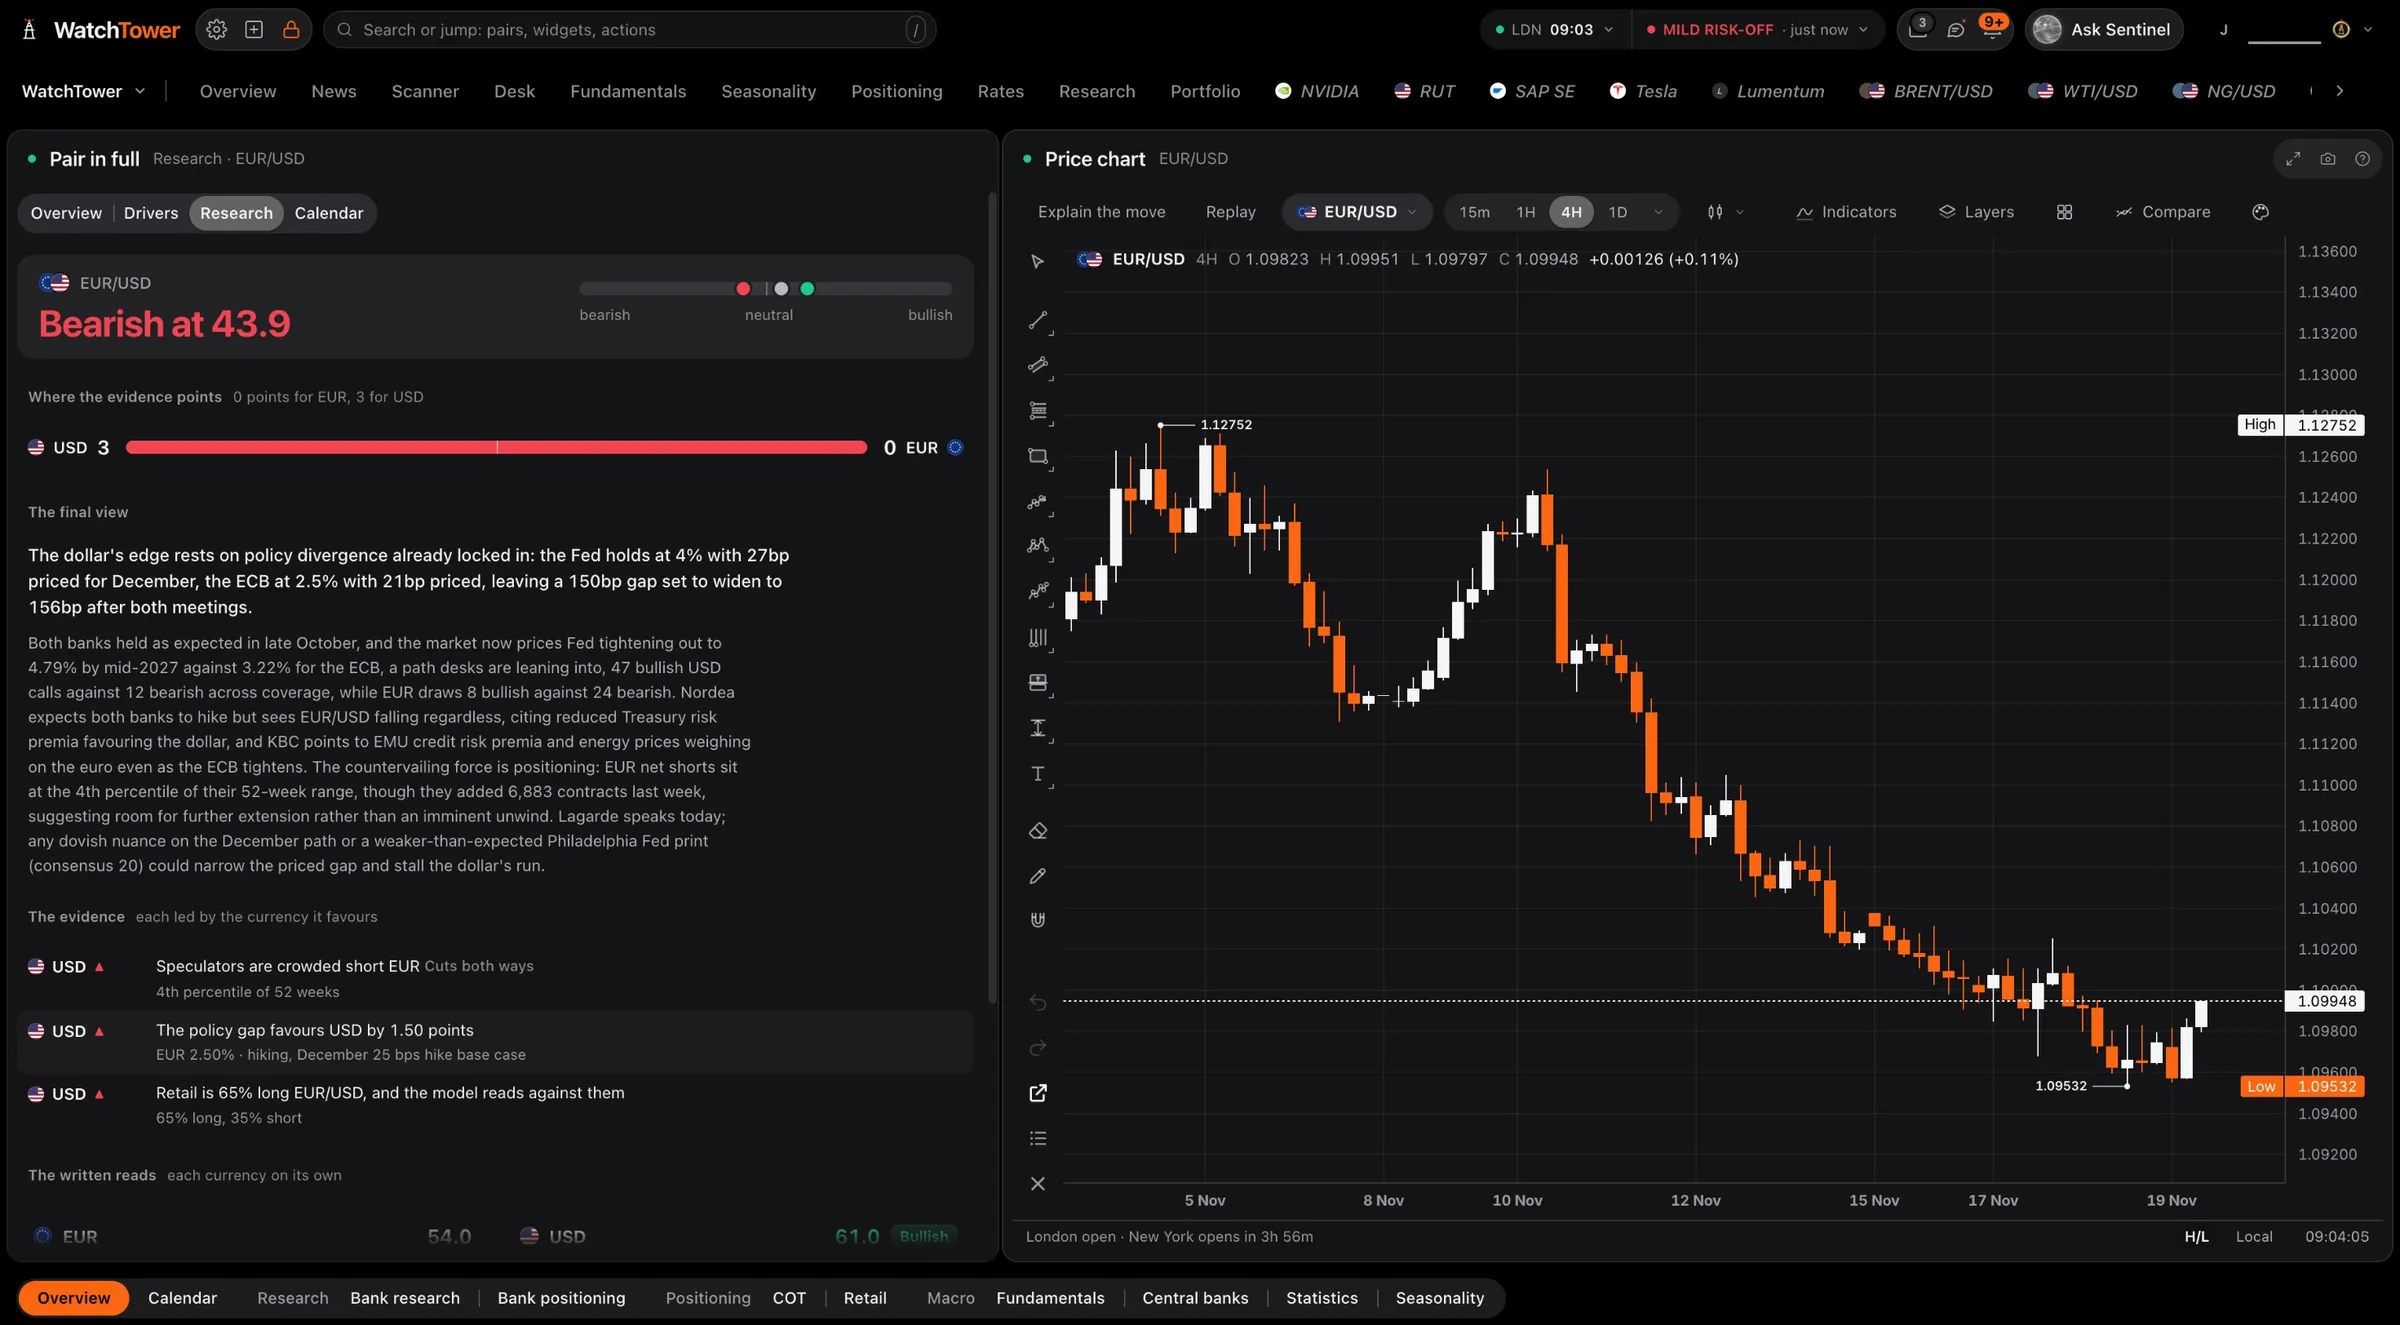
Open any marketOne click into the full research
EUR/USD in fullThe score, the evidence and the chart, side by side
Stock scores are part of Pro, with every market, the bank research and Sentinel: $10 for your first month, then $49 a month. More on every part of the terminal and how we research.
Questions
Which stocks does WatchTower score?
2,900+ stocks: the members of the S&P 500, Nasdaq 100, Dow, Russell 2000, DAX, FTSE 100, CAC 40, Euro Stoxx 50, IBEX 35 and Nikkei 225.
How often are stock scores updated?
Every night, after the close. They don't move during the session.
Can I see the stock scores without an account?
No. Stock scores and drilldowns are part of Pro, at $10 for your first month, then $49 a month.
Are the stock scores final?
They are the newest part of the terminal, and the terminal marks them as in testing while each scale is calibrated across the full list.
Does a high score mean I should buy the stock?
No. A score describes what the data says about a stock today and shows every part behind it. WatchTower never gives an entry, a stop or a position size.