Documentation · Central banks · Pro
Forecast tracker
The Forecast tracker panel in WatchTower Terminal: what the central banks themselves forecast for growth, inflation, unemployment and their own rate, with every round kept. It is on the Pro plan, and it is built on each central bank's own published forecasts for growth, inflation, unemployment and its rate, linked to the document each came from.
What it shows
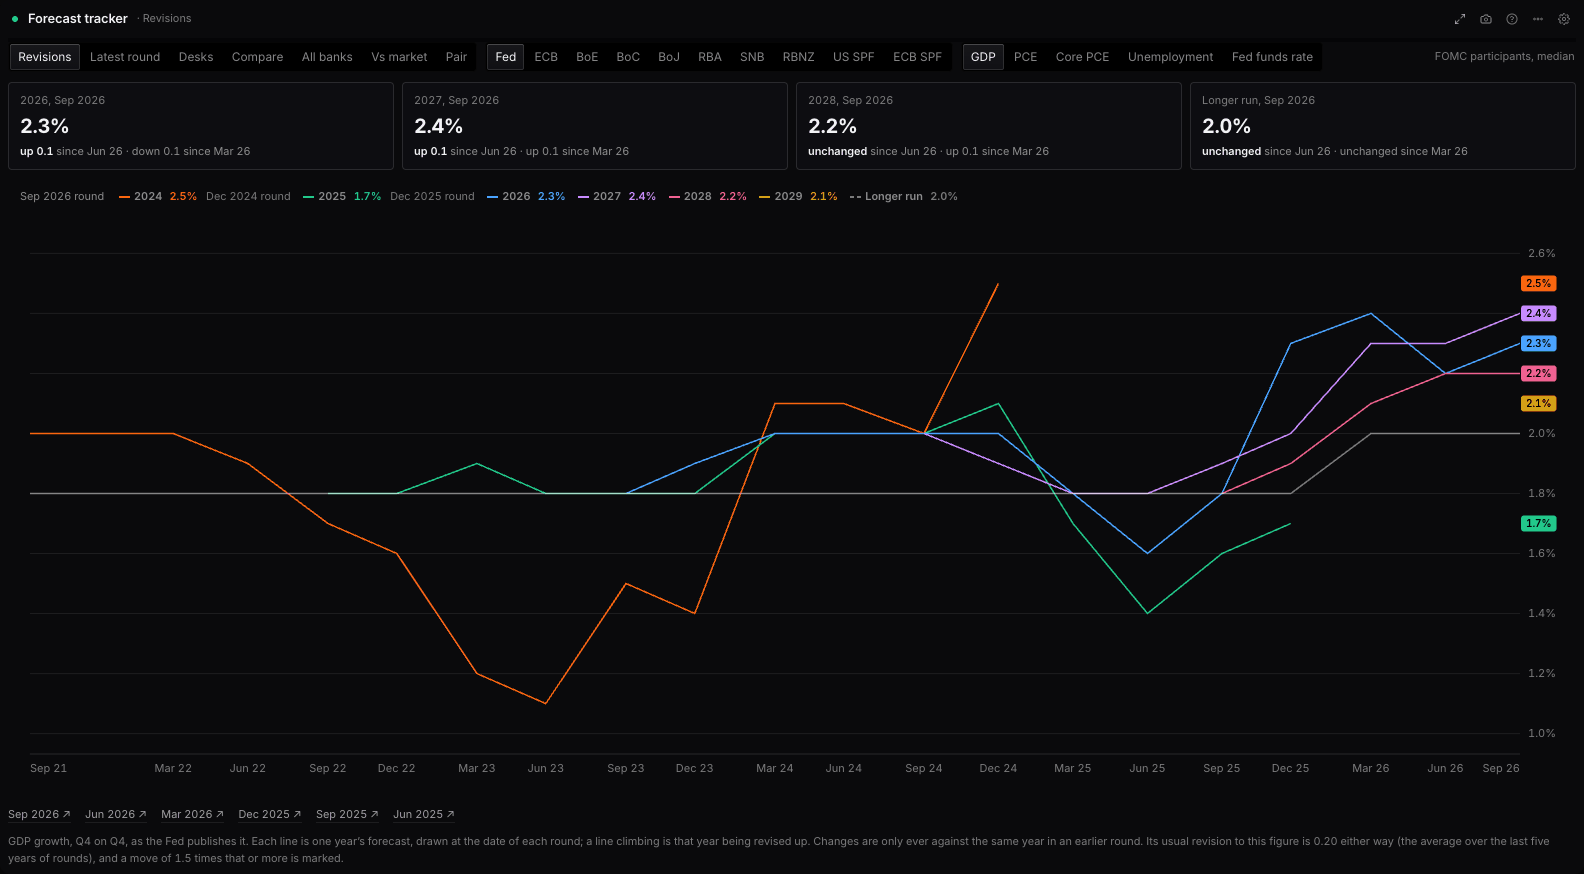
What the central banks themselves forecast for growth, inflation, unemployment and their own rate, with every round kept. One line per year forecast, drawn against the date of each round, so you can see which way a bank keeps revising; the latest figures against the two rounds before; or every indicator at the newest round. Each figure is the bank’s own, on its own basis, linked to the document it came from. The Fed since 2015, the ECB since 1999, the Bank of England since 2022, the Bank of Canada since 2024, the Bank of Japan since 2016, the RBA since 2018, the SNB’s conditional inflation forecast since 2004 and the RBNZ’s projections with its own OCR track.
Its reads
- Revisions
- Latest round
- Desks
- Compare
- All banks
- Vs market
- Pair
The data
- Where it comes from
- Each central bank's own published forecasts for growth, inflation, unemployment and its rate, linked to the document each came from.
- How often it updates
- When a bank publishes a new forecast round.
- Plan
- Pro
Settings
| Setting | What it does | Choices |
|---|---|---|
| View | Revisions: one indicator, every round, one line per year forecast. Latest round: every indicator of the bank at its newest round, each against the round before. Desks: what the bank desks in the research we hold expect, each desk’s latest forecast, the median and spread across them, and which way they have been revising. Vs market: a bank’s policy rate as it publishes it, against the desks’ calls and the path priced today. Pair: the two banks behind a currency pair, their rate gap priced, called and published, and each one’s latest revisions. | Revisions, Latest round, Desks, Compare, All banks, Vs market, Pair |
| Base | — | USD, EUR, GBP, JPY, CHF, AUD, CAD, NZD |
| Quote | — | USD, EUR, GBP, JPY, CHF, AUD, CAD, NZD |
| Compare | Only figures on the same basis are set side by side: the Fed against the US forecasters’ survey on PCE (Q4 on Q4); ECB staff against the ECB survey and the desks’ calendar-year forecasts (annual averages); the Bank of Canada against the desks. Anything else is not comparable and is not shown here. | US PCE inflation, US core PCE inflation, Euro area HICP inflation, Euro area core HICP inflation, Euro area GDP growth, Euro area unemployment, Canada GDP growth, Canada CPI inflation |
| Currency | — | USD, EUR, GBP, JPY, CHF, AUD, CAD, NZD |
| Central bank | The Fed: FOMC participants’ median projections, four rounds a year since September 2015. The ECB: its staff projections, four rounds a year since 1999. The Bank of England: the MPC’s projections in each Monetary Policy Report since May 2022. The Bank of Canada: its staff’s base case in each Monetary Policy Report since October 2024. The Bank of Japan: the Policy Board’s median in each Outlook Report since 2016, by fiscal year. The RBA: its staff forecasts in each Statement on Monetary Policy since November 2018. The SNB: its conditional inflation forecast at every quarterly assessment since June 2004. The RBNZ: the MPC’s projections in each Monetary Policy Statement, with its own OCR track. The two surveys are anonymised panels of professional forecasters: the Philadelphia Fed’s median since 2007 (inflation Q4 on Q4, the Fed’s own basis) and the ECB’s average since 1999 (calendar years, the ECB staff’s basis). | Fed, ECB, Bank of England, Bank of Canada, Bank of Japan, RBA, SNB, RBNZ, and 2 more |
| Indicator | GDP and PCE inflation are Q4 on Q4, unemployment is the Q4 average and the Fed funds rate is the end-of-year midpoint, all as the Fed publishes them. | GDP growth, PCE inflation, Core PCE inflation, Unemployment, Fed funds rate |
| Indicator | Annual averages, as the ECB publishes them. | GDP growth, HICP inflation, Core HICP inflation, Unemployment |
| Indicator | Each figure is for one quarter: GDP growth and CPI inflation over four quarters, unemployment the quarter’s rate. Bank Rate is the market path the MPC conditions its forecast on, which it assumes rather than forecasts. April 2026 is missing: that Report gave three scenarios and no central projection. | GDP growth, CPI inflation, Unemployment, Bank Rate, market path |
| Indicator | GDP growth and CPI inflation as annual averages; core inflation, the average of CPI-trim and CPI-median, Q4 on Q4. The Bank publishes no unemployment or rate projection. April and July 2025 are missing: those Reports gave tariff scenarios and no base case. | GDP growth, CPI inflation, Core inflation |
| Indicator | The median of the Policy Board members’ forecasts, for fiscal years running April to March, so never comparable with a calendar year. CPI less fresh food is Japan’s headline core measure; up to 2019 it includes the effect of the consumption tax rises. Less fresh food and energy is shown from April 2022, when the Bank added it. | GDP growth, CPI less fresh food, CPI less fresh food and energy |
| Indicator | Year-ended rates to the June and December quarters; unemployment the quarter’s average. The cash rate is the market path the forecasts are conditioned on, carried from February 2024: an assumption, not the Board’s call. May 2020 to February 2022 were published rounded, to whole numbers and then half and quarter points. | GDP growth, CPI inflation, Trimmed mean inflation, Unemployment, Cash rate, market path |
| Indicator | The OCR track is the MPC’s own projection of its rate, as a quarter average, which only the RBNZ and the Fed publish. CPI is the annual rate to each quarter; unemployment the quarter’s rate; GDP the annual average for March years (April to March). | OCR track, CPI inflation, Unemployment, GDP growth |
| Indicator | The median of the forecasters surveyed each quarter. Inflation is Q4 on Q4, the same basis as the Fed’s projections; unemployment the annual average, which is not the Fed’s Q4 basis. | PCE inflation, Core PCE inflation, CPI inflation, Core CPI inflation, Unemployment |
| Indicator | The average point forecast of the forecasters surveyed each quarter, for calendar years (the ECB staff’s own basis) and the longer term, about five years ahead. | HICP inflation, Core HICP inflation, GDP growth, Unemployment |
| Rounds shown | — | The last 2 years, The last 5 years, The last 10 years, Every round held |
| Longer run | Where the Fed’s participants expect each figure to settle in the longer run. | Show, Hide |
Questions
What does the Forecast tracker panel show?
What the central banks themselves forecast for growth, inflation, unemployment and their own rate, with every round kept. One line per year forecast, drawn against the date of each round, so you can see which way a bank keeps revising; the latest figures against the two rounds before; or every indicator at the newest round. Each figure is the bank’s own, on its own basis, linked to the document it came from. The Fed since 2015, the ECB since 1999, the Bank of England since 2022, the Bank of Canada since 2024, the Bank of Japan since 2016, the RBA since 2018, the SNB’s conditional inflation forecast since 2004 and the RBNZ’s projections with its own OCR track.
Where does Forecast tracker's data come from, and how often does it update?
Each central bank's own published forecasts for growth, inflation, unemployment and its rate, linked to the document each came from. When a bank publishes a new forecast round.
Is Forecast tracker free?
Forecast tracker is on the Pro plan: $10 for the first month, then $49 a month, or $490 a year.
Free on this site: Rate probability for all 8 banks · Meeting calendar 2027
Also in Central banks: Rate spread · Central bank · Next decisions · Rates across banks
WatchTower Terminal has 50 panels; this page documents one. Nothing here is financial advice.