Documentation · Scores & bias · Pro
Score history
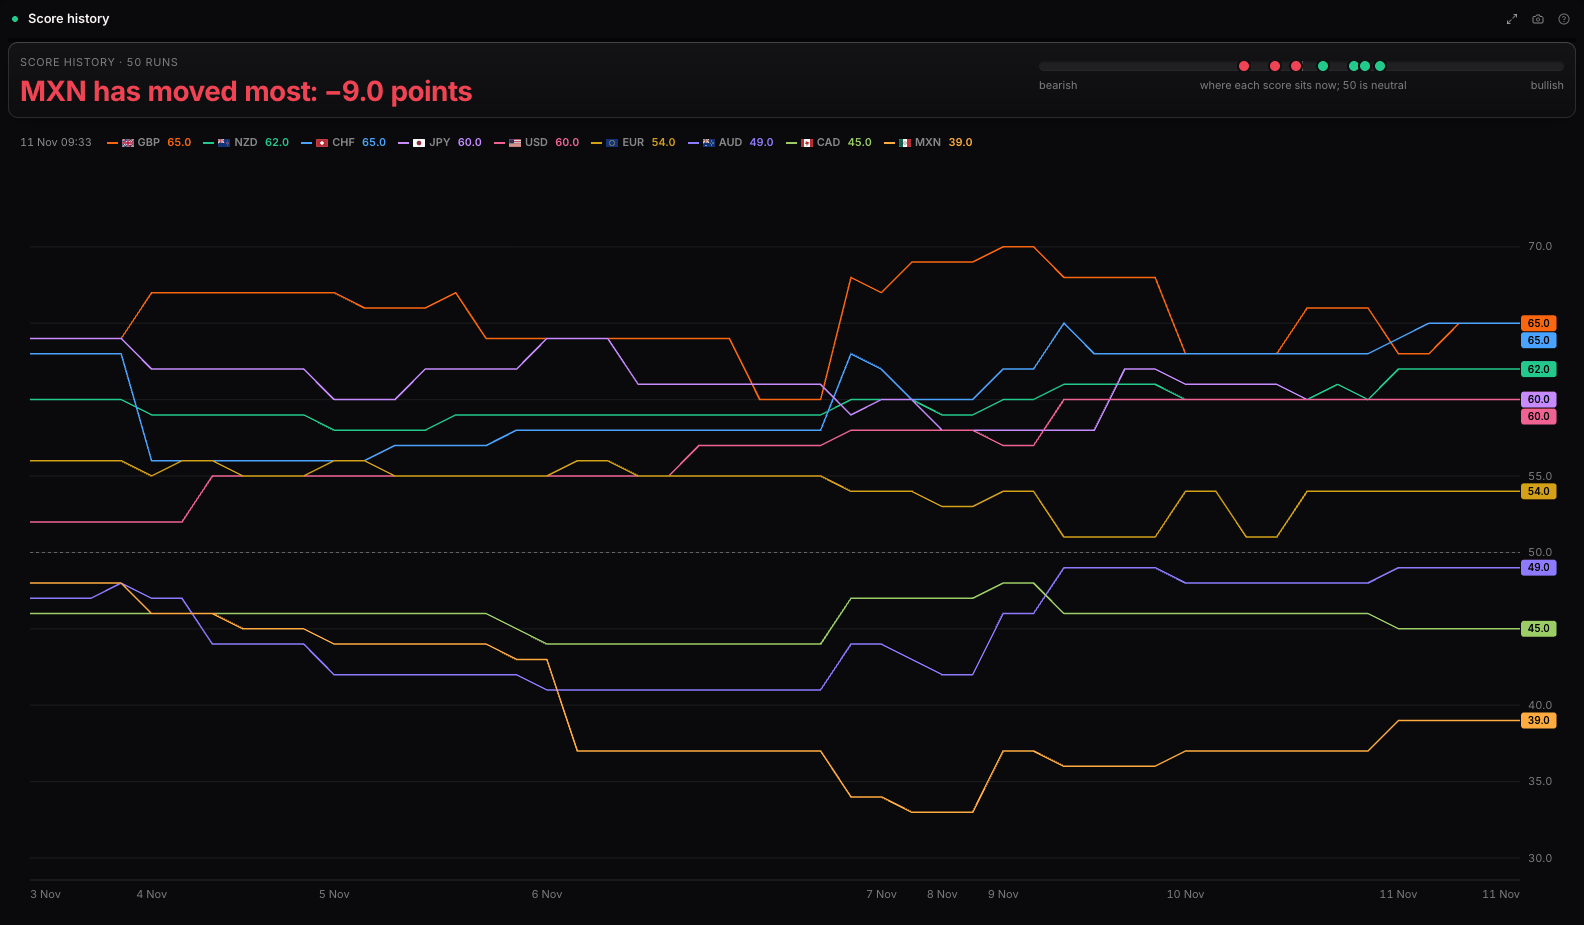
The Score history panel in WatchTower Terminal: how the scores have moved, across assets, five ways: each asset’s composite over its recent runs; what has shifted since a run or ten ago, and which crossed neutral; where the score and the price disagree; which assets lead, fade, lag or improve against the rest; and one market’s bullish and bearish runs on its price chart, with what price did across each and how often it went the score’s way. It is on the Pro plan, and it is built on the terminal's own composite, built from fundamentals, central bank pricing, bank research, seasonality, retail and CFTC positioning on published weights.
What it shows
How the scores have moved, across assets, five ways: each asset’s composite over its recent runs; what has shifted since a run or ten ago, and which crossed neutral; where the score and the price disagree; which assets lead, fade, lag or improve against the rest; and one market’s bullish and bearish runs on its price chart, with what price did across each and how often it went the score’s way.
Its reads
- Score history
- What moved
- Against price
- Rotation
- On the price chart
The data
- Where it comes from
- The terminal's own composite, built from fundamentals, central bank pricing, bank research, seasonality, retail and CFTC positioning on published weights.
- How often it updates
- Rescored every morning at 07:00 UTC, on Friday evening after the COT release, and whenever new bank research is read.
- In the score
- This panel is the score: it shows the composite and the share each input carries.
- Plan
- Pro
Settings
| Setting | What it does | Choices |
|---|---|---|
| Read | Each asset’s score over its recent runs; what has shifted since a run or ten ago; where the score and the price disagree; which assets lead, fade, lag or improve against the rest; or one market’s bullish and bearish runs on its price chart, with what price did across each. | Score history, What moved, Against price, Rotation, On the price chart |
| Assets | Pick everything, a whole class, or any combination of individual assets. | All assets |
| Runs shown | The scorer runs on a schedule and after every high-impact print, so runs are not evenly spaced in time. | Last 20 runs, Last 50 runs, Last 100 runs, Every run held |
| Compared with | — | The previous run, 5 runs ago, 10 runs ago |
| Smallest move | — | Every move, 1 point or more, 3 points or more |
| Unchanged assets | — | Hide, Show |
| Window | How far the score sits in its own range over this window, against how far price sits in its own. | 10 days, 20 days, 60 days, 120 days |
| Markets | — | All markets, FX pairs only, Metals and indices only |
| Direction | — | Both ways, Score above price, Price above score |
| Rows shown | — | Top 5, Top 10, Top 20, All |
| Tail | — | 5 runs, 8 runs, 12 runs, 16 runs |
| Momentum over | — | 3 runs, 5 runs, 10 runs |
| Market | — | EUR/USD, GBP/USD, USD/JPY, USD/CHF, AUD/USD, NZD/USD, USD/CAD, EUR/GBP, and 35 more |
| Timeframe | — | Daily, 4 hours, Weekly |
| Runs counted | Which runs the count at the top is made from. A run still going is shown and never counted, and nor is one read from the weekly scores of an earlier model. | Last 6 months, Last 12 months, Everything held |
| Flags | — | Show, Hide |
| Summary card | The headline card at the top of the panel. Hide it where another panel on the board already says the same. | Show, Hide |
Questions
What does the Score history panel show?
How the scores have moved, across assets, five ways: each asset’s composite over its recent runs; what has shifted since a run or ten ago, and which crossed neutral; where the score and the price disagree; which assets lead, fade, lag or improve against the rest; and one market’s bullish and bearish runs on its price chart, with what price did across each and how often it went the score’s way.
Where does Score history's data come from, and how often does it update?
The terminal's own composite, built from fundamentals, central bank pricing, bank research, seasonality, retail and CFTC positioning on published weights. Rescored every morning at 07:00 UTC, on Friday evening after the COT release, and whenever new bank research is read.
Is Score history free?
Score history is on the Pro plan: $10 for the first month, then $49 a month, or $490 a year.
Does Score history feed the composite score?
This panel is the score: it shows the composite and the share each input carries.
Free on this site: Every market's score, free · The scoring model in full
Also in Scores & bias: Asset in full · Asset scores
WatchTower Terminal has 50 panels; this page documents one. Nothing here is financial advice.