Documentation · Currency fundamentals · Pro
Macro indicator history
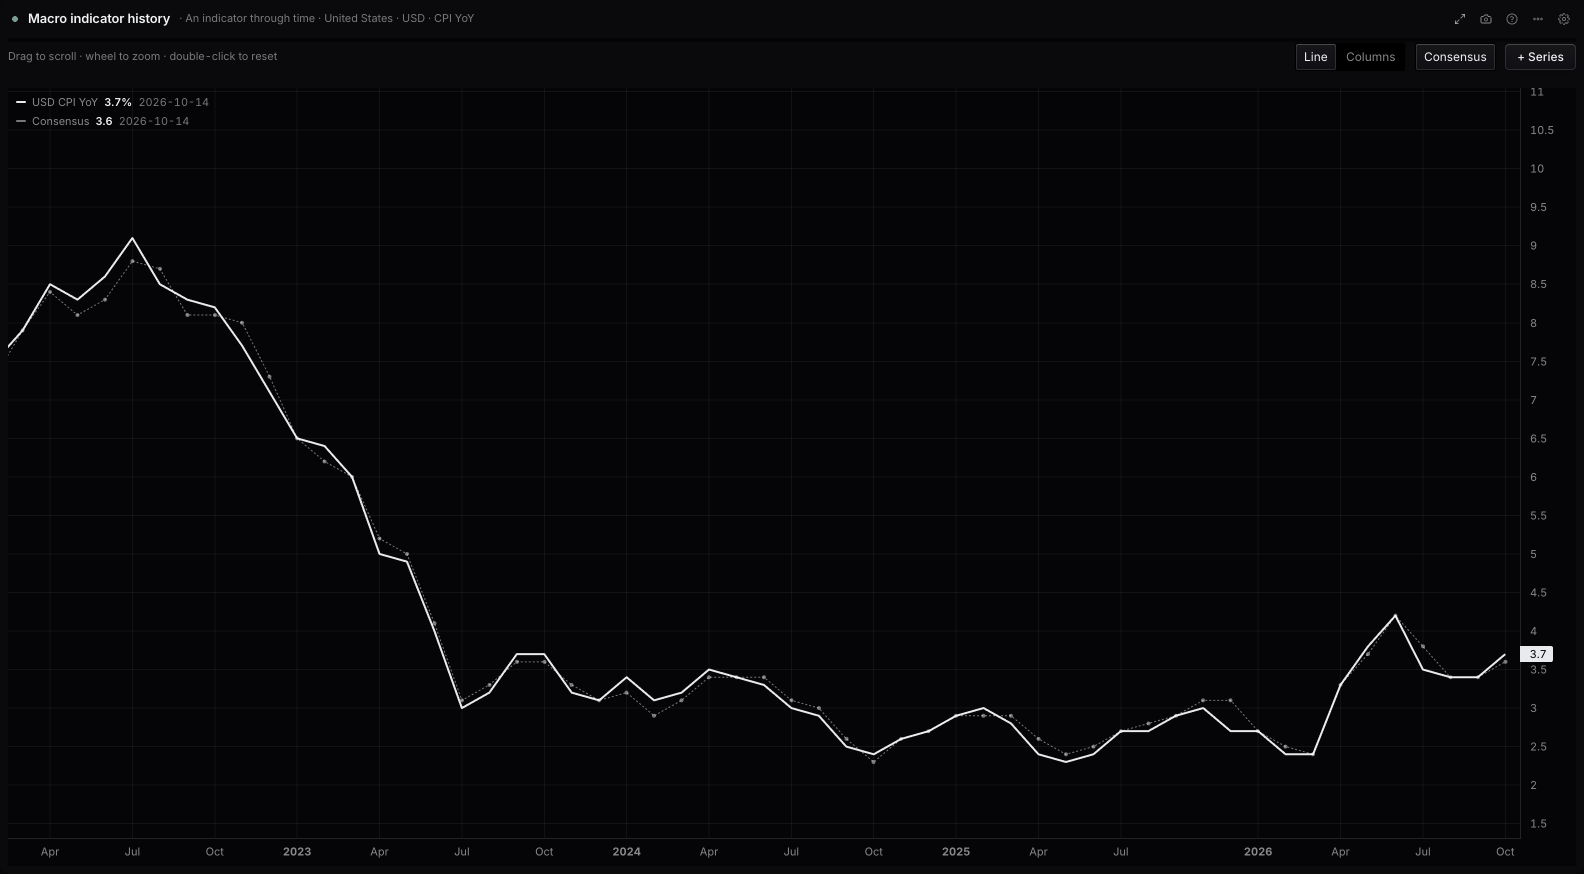
The Macro indicator history panel in WatchTower Terminal: any currency's economic indicator as a chart: compare series across currencies, rescale them, switch between line and columns, and read every value under the crosshair. It is on the Pro plan, and it is built on official releases from national statistics offices and central banks, with the consensus that stood before each print.
What it shows
Any currency's economic indicator as a chart: compare series across currencies, rescale them, switch between line and columns, and read every value under the crosshair.
Its reads
- Line
- Columns
The data
- Where it comes from
- Official releases from national statistics offices and central banks, with the consensus that stood before each print.
- How often it updates
- As each release prints.
- In the score
- Fundamentals carry 22.5% of each currency's composite score.
- Plan
- Pro
Settings
| Setting | What it does | Choices |
|---|---|---|
| Currency | — | United States · USD, Euro area · EUR, United Kingdom · GBP, Japan · JPY, Switzerland · CHF, Australia · AUD, Canada · CAD, New Zealand · NZD, and 1 more |
| Indicator | Scored macro releases plus market reference series. | CPI (index level), Core CPI (index level), Core PCE (index level), CPI YoY, PPI YoY, PCE YoY, Unemployment Rate · full history, Nonfarm Payrolls · full history, and 82 more |
| Compare with | Any indicator from any country, mixed freely. | Nothing, United States · USD, Euro area · EUR, United Kingdom · GBP, Japan · JPY, Switzerland · CHF, Australia · AUD, Canada · CAD, and 2 more |
| Indicator | — | Filled from the data |
| And | — | Nothing, United States · USD, Euro area · EUR, United Kingdom · GBP, Japan · JPY, Switzerland · CHF, Australia · AUD, Canada · CAD, and 2 more |
| Indicator | — | Filled from the data |
| And | — | Nothing, United States · USD, Euro area · EUR, United Kingdom · GBP, Japan · JPY, Switzerland · CHF, Australia · AUD, Canada · CAD, and 2 more |
| Indicator | — | Filled from the data |
| Opens on | The span the chart shows when it opens. Scroll or drag for the rest of the history; zoom with the wheel; double-click to come back. | 1Y, 2Y, 5Y, 10Y |
| Shape | Columns suit a change, such as payrolls; a line suits a level. Columns draw one series at a time. | Line, Columns |
| Chart controls | Range and chart type as buttons above the plot. Turn off for a bare chart on a dense tab. | On the chart, Settings only |
| Scale | Automatic uses one axis for one unit, two axes for two, and indexes when there are more. | Automatic, One axis, Two axes, Indexed to 100 |
| Transform | Applied to every series. Changes and averages are over calendar months, so a daily price and a monthly print are measured over the same span. Z-score and percentile place each reading against up to five years of its own history. | Level, Change since the last reading, 3-month change, 6-month change, 12-month change, % change over 12 months, 3-month average, Z-score, 5 years, and 1 more |
| First two series | One line for the gap between them: AU 2Y minus CA 2Y, or US PMI minus euro-area PMI. The second is read as it stood on each of the first’s dates. | Side by side, First minus second |
| Rolling correlation | How closely the first two lines have moved together, on their changes rather than their levels. Daily when both are daily; otherwise month by month. | Off, Short: 20 days, or 12 months, Medium: 60 days, or 24 months, Long: a year, or 36 months |
| Consensus | One series: the published consensus is drawn against the print, on lines and on columns alike. Several series: each one reports how often it printed above, below and in line, which is the comparison four overlaid forecast lines would bury. | Show, Actual only |
Questions
What does the Macro indicator history panel show?
Any currency's economic indicator as a chart: compare series across currencies, rescale them, switch between line and columns, and read every value under the crosshair.
Where does Macro indicator history's data come from, and how often does it update?
Official releases from national statistics offices and central banks, with the consensus that stood before each print. As each release prints.
Is Macro indicator history free?
Macro indicator history is on the Pro plan: $10 for the first month, then $49 a month, or $490 a year.
Does Macro indicator history feed the composite score?
Fundamentals carry 22.5% of each currency's composite score.
Free on this site: Economic surprise by currency · Every market's score
Also in Currency fundamentals: Economic health · Macro state · Data surprises · Macro fundamentals
WatchTower Terminal has 50 panels; this page documents one. Nothing here is financial advice.