Documentation · Positioning · Pro
COT positioning
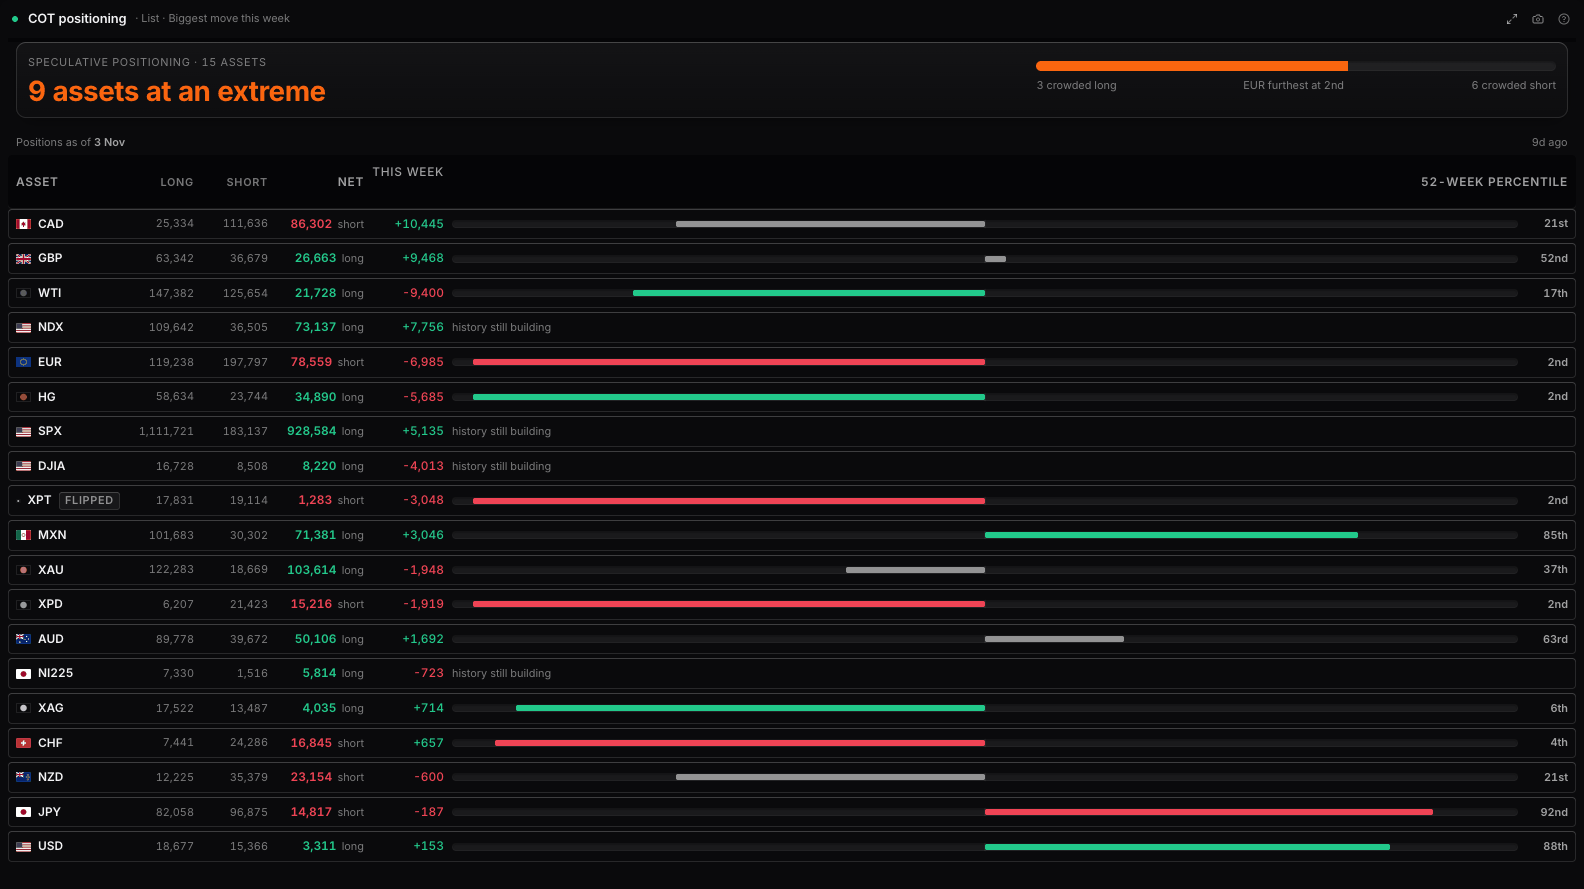
The COT positioning panel in WatchTower Terminal: every asset with its net speculative position, what it did against the prior report, and where that sits in its own 52-week range. It is on the Pro plan, and it is built on the CFTC Commitments of Traders report, and aggregated retail broker positioning.
What it shows
Every asset with its net speculative position, what it did against the prior report, and where that sits in its own 52-week range. Rank by the move, by how crowded it is, or by size, and filter to the crowded end or to the assets that flipped side.
Its reads
- List
- Percentile against net
- Crowding against the weekly move
How to use it
This is the fastest way to find where the crowd is concentrated without opening one market at a time. Read it as a shortlist rather than a signal: the markets at either end are the ones where a surprise has the most positioning to unwind. It is most useful held against a view you already have. A macro case for a currency that is also sitting at the 5th percentile is a very different proposition from the same case at the 95th, because in the second one the trade is already on and you are late to it.
The data
- Where it comes from
- Every tracked market ranked by how far its speculative net position sits within its own 52 week range, expressed as a percentile. The 100th percentile is the most net long that market has been in a year; the 0th is the most net short. Measuring against each market’s own history is what makes the ranking comparable. Gold and the New Zealand dollar trade in completely different contract sizes, so their raw net figures cannot be set beside each other. Their percentiles can. Same source and same lag as COT history: published Friday, measured the previous Tuesday.
- How often it updates
- CFTC weekly: published on Friday for positions as of the Tuesday before. Retail every 20 minutes.
- In the score
- COT level and COT flow carry 9% each of a currency's composite; retail positioning 10%, read contrarian.
- Plan
- Pro
Settings
| Setting | What it does | Choices |
|---|---|---|
| Assets | Pick everything, a whole class, or any combination of individual assets. | All assets |
| Order | Most crowded ranks on distance from the middle of the asset’s own 52-week range, so a record short ranks beside a record long. | Biggest move this week, Most crowded, Largest net position, Alphabetical |
| Show | Crowded is at or beyond the 80th or 20th percentile of the last 52 weeks. Flipped is net positioning crossing zero between the two reports. | Every asset, Crowded only, Flipped side only |
| Minimum move | Net contracts against the prior report. Hides the small drifts that are noise on a weekly series. | Every change, 1,000 contracts or more, 5,000 contracts or more |
| Visualisation | Percentile against net puts every asset on one chart: how far it sits in its own 52-week range, and how big and which way the net position is. Crowding against the weekly move shows whether a crowded position is still building or unwinding; the dot size is the size of the net position. | List, Percentile against net, Crowding against the weekly move |
| Summary card | The headline card at the top of the panel. Hide it where another panel on the board already says the same. | Show, Hide |
Questions
What does the COT positioning panel show?
Every asset with its net speculative position, what it did against the prior report, and where that sits in its own 52-week range. Rank by the move, by how crowded it is, or by size, and filter to the crowded end or to the assets that flipped side.
Where does COT positioning's data come from, and how often does it update?
The CFTC Commitments of Traders report, and aggregated retail broker positioning. CFTC weekly: published on Friday for positions as of the Tuesday before. Retail every 20 minutes.
Is COT positioning free?
COT positioning is on the Pro plan: $10 for the first month, then $49 a month, or $490 a year.
Does COT positioning feed the composite score?
COT level and COT flow carry 9% each of a currency's composite; retail positioning 10%, read contrarian.
Free on this site: This week's COT report · Gold COT positioning
Also in Positioning: Retail history · COT history · Retail positioning
WatchTower Terminal has 50 panels; this page documents one. Nothing here is financial advice.